
In the last few days we’ve seen the impressive crypto performance from July and August – Bitcoin (BTC) breaking a multi-year barrier and following through on it – take an inevitable correction. This correction has rippled into the altcoin markets as well, and OKEx’s exchange token OKB’s long uptrend looks a bit stalled on the high timeframe charts.
Starting on the daily charts, we see that the medium-term market is threatening to head down if $5.50 cannot be held. This zone marks the inflection point of this timeframe, and we have already seen one breach-with-defense of this area. OKB can probably not absorb another.
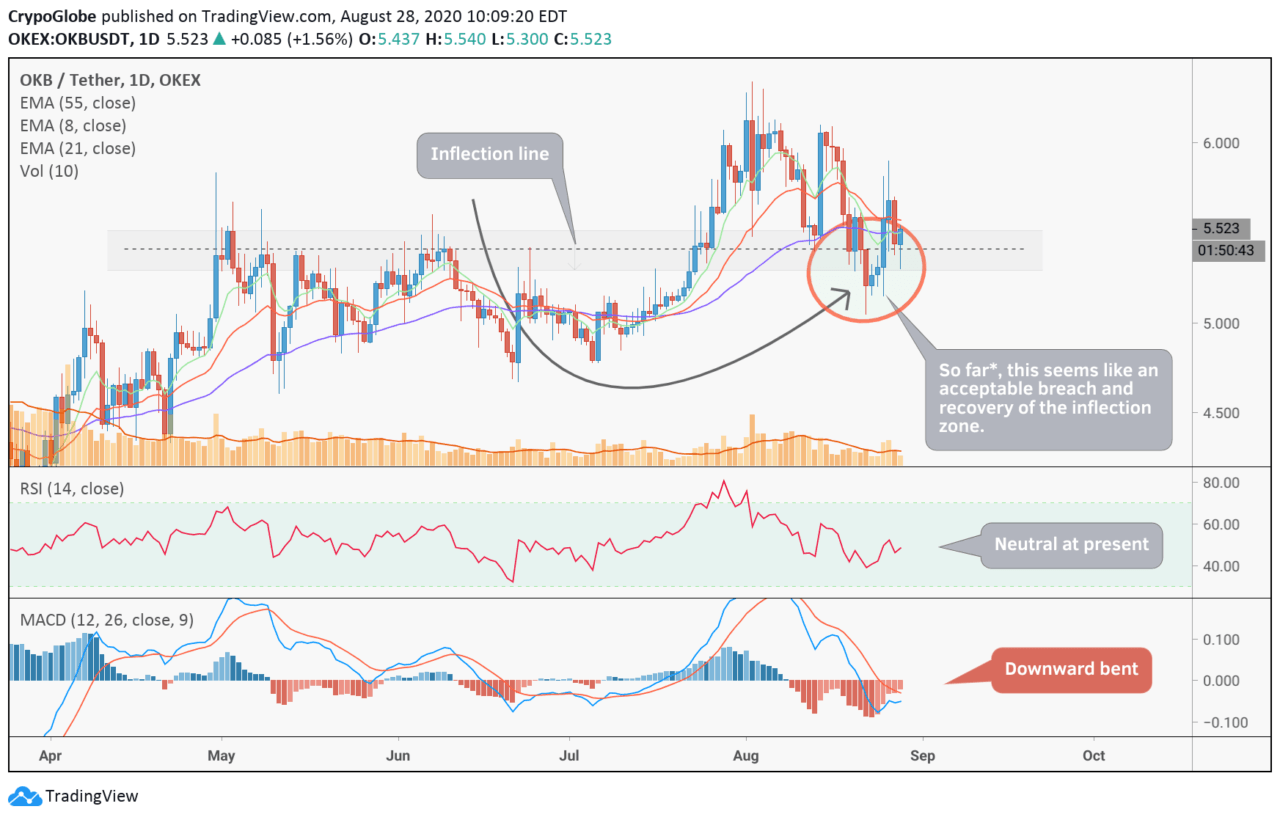
We don’t get any hints of reversal on the RSI, with no divergences and a downtrend gradually going flat. The histogram is not looking good, with a larger formation down and a descending histogram. We could well see a breakdown.
Going to the weekly, we see price just holding on to the 21 EMA, after having tested it already a couple of months ago. If we lose the 21, the 55 is the next bet at somewhere between $4 and $4.50.
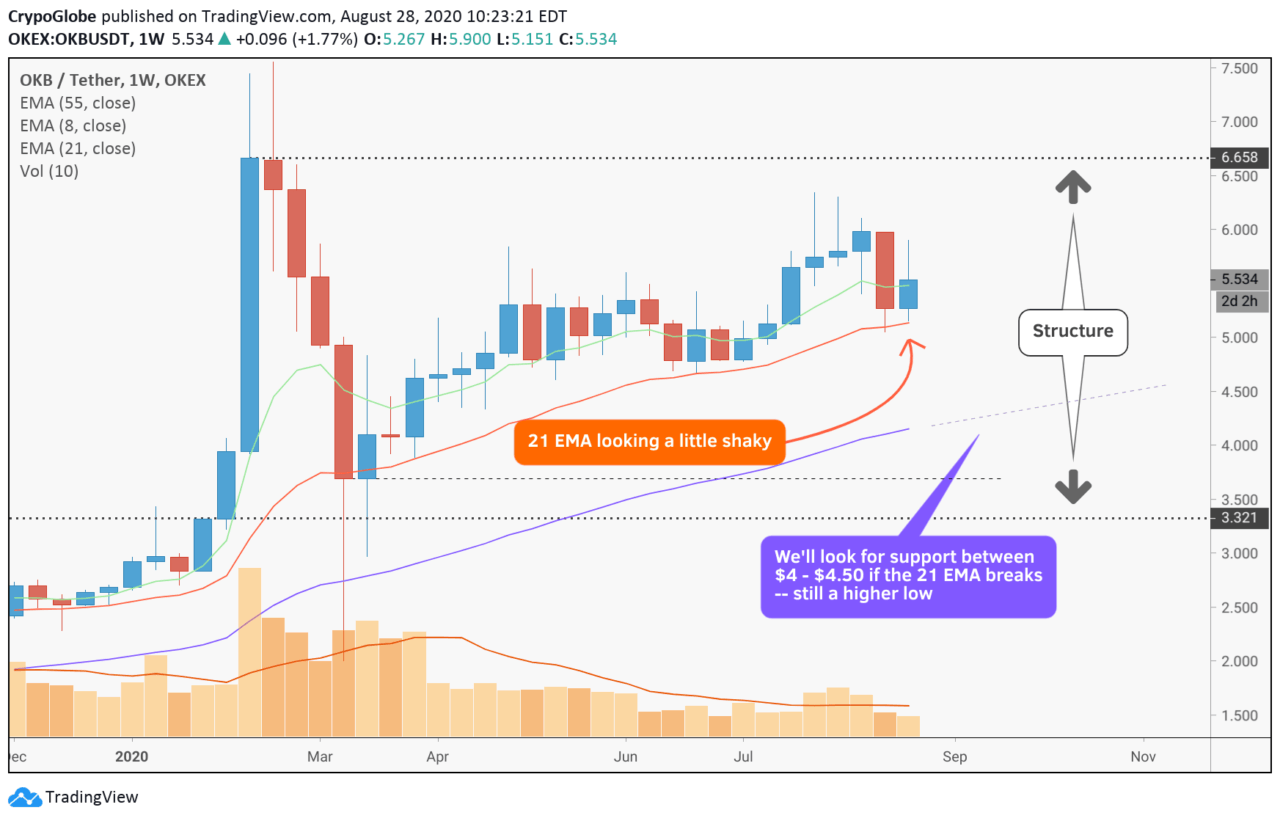
The good news is that, holding there would still constitute a higher high on the high timeframe, and thus not destroy the (very) long term uptrend. The absolute bottom of this chart is about $3.50.
Things look rosier for daytraders, with a reverse head and shoulders having put in work in the last few days. A classic bull divergence signaled a surge, and the bullish MACD/histogram suggests that this could continue up to the shoulder line around $5.80.

But because of the larger bearish picture, we can’t expect more than that.
The views and opinions expressed here do not reflect those of CryptoGlobe.com and do not constitute financial advice. Always do your own research.
Featured Image Credit: Photo via Pixabay.com