

Introduction
This report provides a comprehensive analysis of Cardano (ADA) for 4 July 2023. The data includes real-time price, volume, bid/ask, day’s range, technical indicators, and moving averages.
Price and Volume Overview
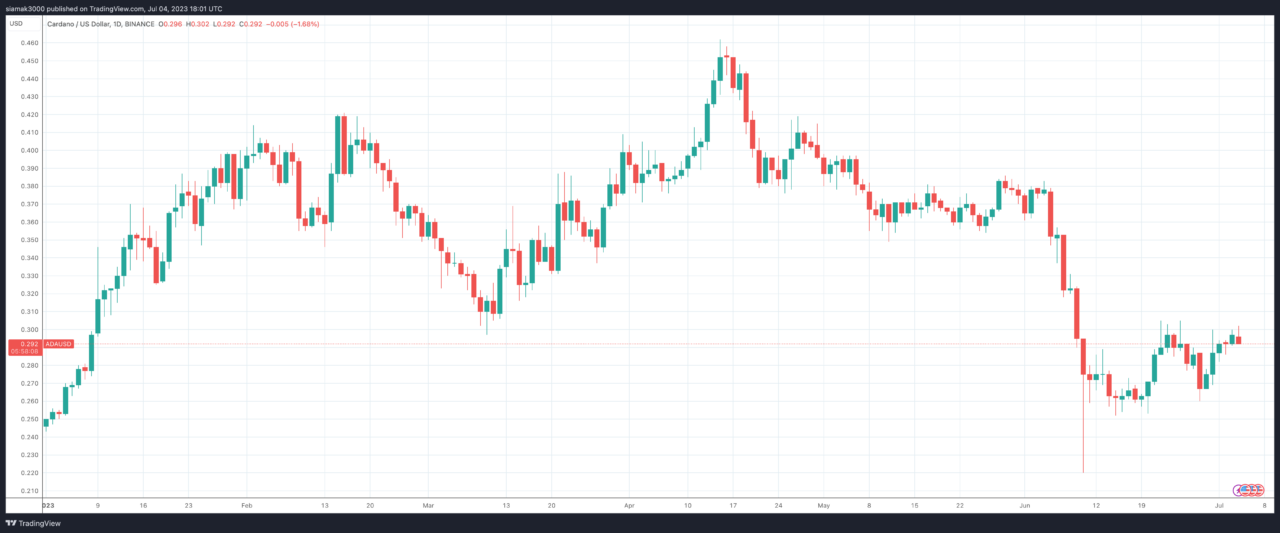
As of 5:29:14 p.m. UTC on 4 July 2023, Cardano is trading at $0.2929, down by $0.0013 (-0.44%) from its previous close. The trading volume over the last 24 hours was 96,613,084 ADA. The bid price is $0.2928, and the ask price is $0.2929. The day’s range is between $0.2922 and $0.3016.
Technical Indicators
Technical indicators are used to predict future price movements and market trends.
Here’s a detailed breakdown of the technical indicators for Cardano (ADA):
- RSI(14): The 14-day Relative Strength Index is 42.554, indicating a sell position. The RSI measures the speed and change of price movements on a scale of 0 to 100. Traditionally, the asset is considered overbought when the RSI is above 70 and oversold when it’s below 30. In this case, ADA is closer to the oversold range, suggesting a bearish market condition.
- STOCH(9,6): The Stochastic Oscillator is 24.604, indicating a sell condition. This momentum indicator compares a particular closing price of the asset to a range of its prices over a certain period of time. The current value suggests that ADA is closer to its lows than its highs, which is typically viewed as a bearish signal.
- STOCHRSI(14): The Stochastic RSI is 0.000, indicating an oversold condition. This is a technical momentum indicator that compares the level of the RSI to its high-low range over a set time period. An oversold condition could indicate a buying opportunity as the price might increase soon.
- MACD(12,26): The Moving Average Convergence Divergence is -0.000, indicating a sell position. The MACD is a trend-following momentum indicator that shows the relationship between two moving averages of a security’s price. The MACD line crossing below the signal line can be a bearish signal, and when it crosses above, it can be a bullish signal. In this case, the MACD line is below the signal line, indicating a bearish signal.
- ADX(14): The Average Directional Index is 23.381, indicating a neutral position. The ADX is used to measure the strength or weakness of a trend, not the actual direction. Values above 25 may indicate a strong trend.
- Williams %R: The Williams %R is -95.402, indicating an oversold condition. This momentum indicator measures overbought and oversold levels. Readings above -20 are considered overbought, and readings below -80 are considered oversold. The current reading suggests that ADA is in an oversold condition.
- CCI(14): The Commodity Channel Index is -140.0708, indicating a sell position. The CCI is a momentum-based oscillator used to help determine when an investment vehicle is reaching a condition of being overbought or oversold. A CCI above 100 may indicate an overbought condition, while a CCI below -100 may indicate an oversold condition.
- ATR(14): The Average True Range is 0.0023, indicating less volatility. The ATR is a technical analysis indicator that
- measures market volatility by decomposing the entire range of an asset price for that period. Lower values typically represent less volatility and smaller price movements.
- Highs/Lows(14): The value is -0.0014, indicating a sell position. This indicator is used to identify the highest and lowest prices for the asset over a particular period.
- Ultimate Oscillator: The value is 36.198, indicating a sell position. This is a technical indicator that is used to measure momentum across multiple timeframes. A value below 30 often indicates an oversold condition, while a value above 70 indicates an overbought condition.
- ROC: The Rate of Change is -2.170, indicating a sell position. The ROC is a momentum oscillator, which measures the percentage change between the current price and the n-period past price. A negative ROC indicates a bearish signal, suggesting that the price is decreasing.
- Bull/Bear Power(13): The value is -0.0027, indicating a sell position. These indicators measure the balance of power between bulls (buyers) and bears (sellers). A negative value indicates that bears are in control.
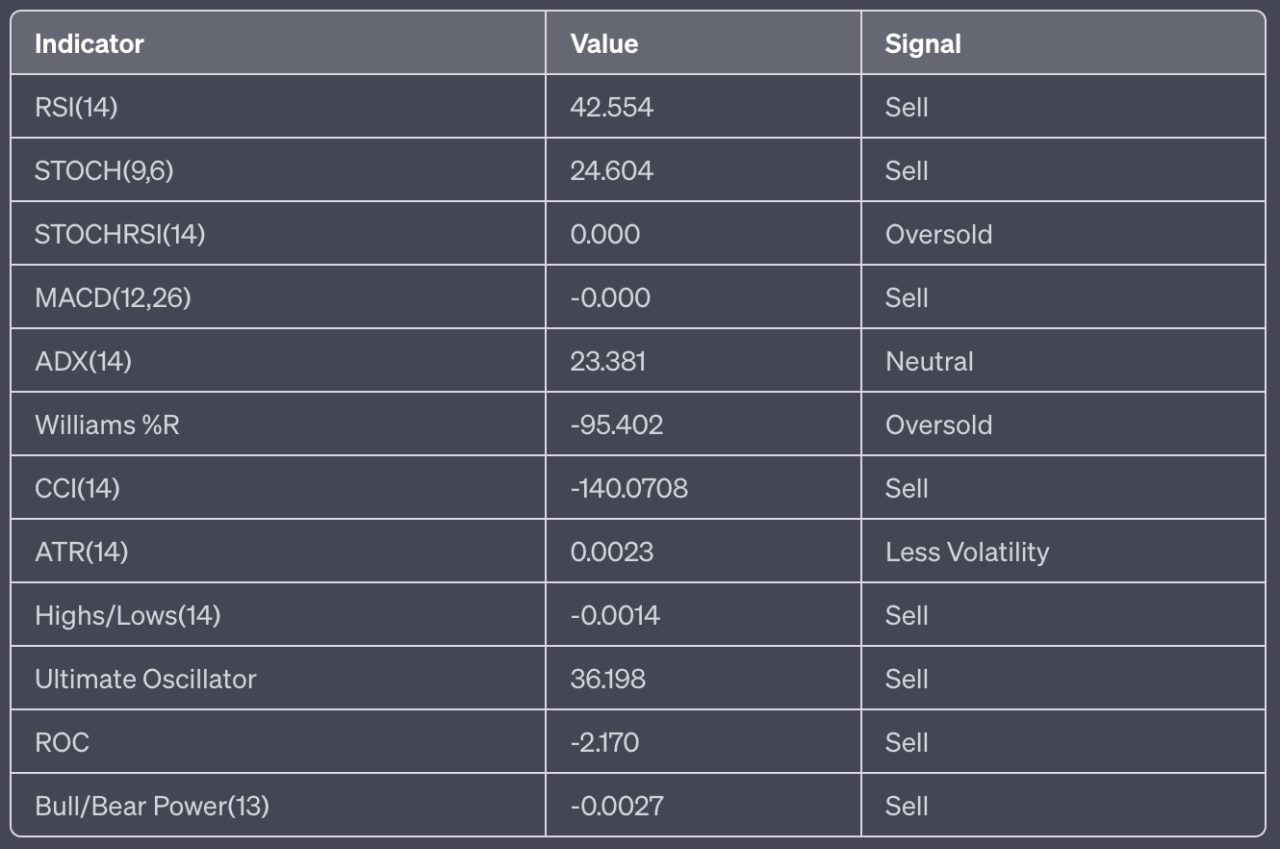
In summary, the vast majority of the technical indicators suggest a “SELL” action for Cardano (ADA). The oversold conditions indicated by the Stochastic RSI and Williams %R could suggest a potential price correction in the near future. However, the overall bearish signals from other indicators such as RSI, STOCH, MACD, CCI, ROC, and Bull/Bear Power suggest that the market sentiment for ADA is currently bearish.
Moving Averages
Moving averages are a type of data smoothing technique that analysts use in technical analysis to identify trends in a set of data, such as stock prices. They help to reduce the noise and fluctuation in price data to present a smoother line, making it easier to see the overall direction or trend.
Here’s a detailed breakdown of the moving averages for Cardano (ADA):
- MA5: The 5-day moving average is 0.2938 (simple) and 0.2939 (exponential), both indicating a sell position. This suggests that the price is below the average of the past 5 days, which is a bearish signal.
- MA10: The 10-day moving average is 0.2946 (simple) and 0.2946 (exponential), both indicating a sell position. This suggests that the price is below the average of the past 10 days, which is a bearish signal.
- MA20: The 20-day moving average is 0.2957 (simple) and 0.2950 (exponential), both indicating a sell position. This suggests that the price is below the average of the past 20 days, which is a bearish signal.
- MA50: The 50-day moving average is 0.2942 (simple) and 0.2939 (exponential), both indicating a sell position. This suggests that the price is below the average of the past 50 days, which is a bearish signal.
- MA100: The 100-day moving average is 0.2910 (simple) and 0.2910 (exponential), both indicating a buy position. This suggests that the price is above the average of the past 100 days, which is a bullish signal.
- MA200: The 200-day moving average is 0.2851 (simple) and 0.2875 (exponential), both indicating a buy position. This suggests that the price is above the average of the past 200 days, which is a bullish signal.
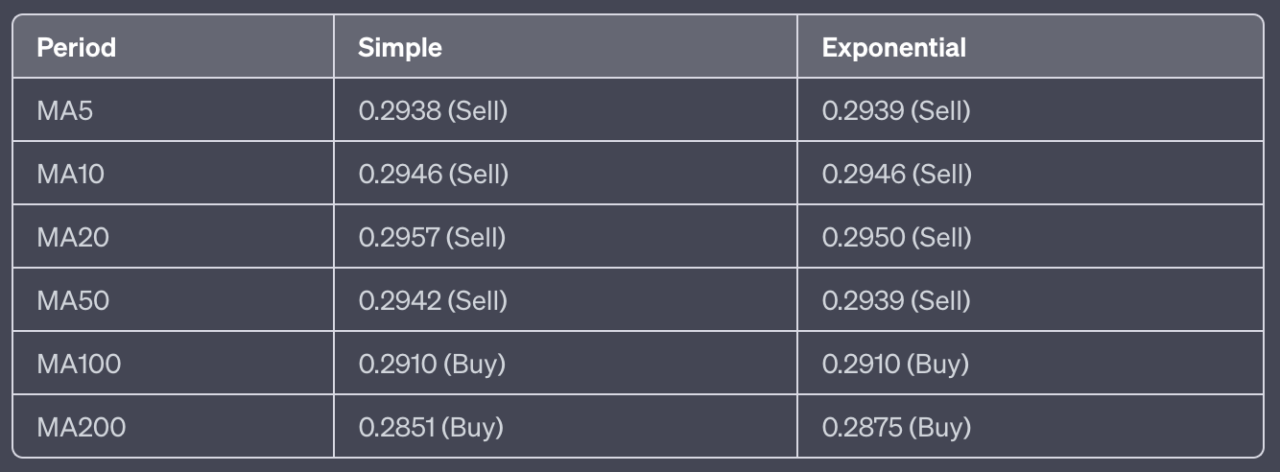
In summary, the moving averages suggest a “SELL” signal for Cardano (ADA), with eight sell signals and four buy signals. The short-term trend, indicated by the 5-day, 10-day, 20-day, and 50-day moving averages, is bearish. However, the medium and long-term trends, indicated by the 100-day and 200-day moving averages, are bullish. This suggests a potential for price recovery in the longer term despite the short-term downward trend.
Conclusion
Overall, the market sentiment for Cardano (ADA) as of 4 July 2023 leans towards caution. The data suggests a stronger inclination towards selling rather than buying. However, there are indications of potential long-term recovery. As always, these insights should be used as part of a broader strategy that includes other market information and personal research.


