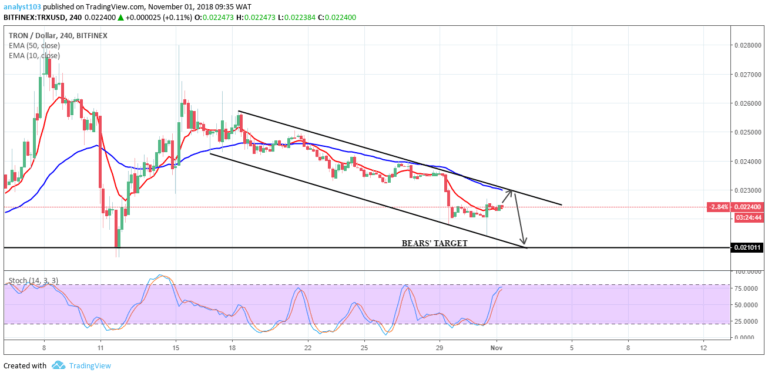
TRX/USD Medium-term Trend:Bearish
- Supply zones: $0.04000, $0.05000, $0.06000
- Demand zones: $0.01000, $0.00900, $0.00800
TRON is in a bearish trend in its medium-term outlook. The strong bears’ pressure as predicted led to the break of the lower demand area of the range on 2nd March. Increased momentum further led to a price drop to $0.02273 in the demand area before a brief loss in momentum.
The correction to the bearish impulsive move pushed TRXUSD up at $0.02351 in the supply area as exhaustion sets in around the 10-EMA.
With the formation of a bearish marubozu candle, this signalled the bears returned with the $0.02392 as the low of the day.
Today’s 4-hour opening candle is bearish at $0.02293 an indication of sustained bears pressure. TRXUSD is already down at $0.02175 in the demand area. Further downward movement is expected in the medium-term as confirmed by price below the two EMAs and the stochastic oscillator signal pointing down at 9% in the oversold region.
TRX/USD Short-term Trend: Bearish
 Tron chart by tradingview
The cryptocurrency returns to a bearish trend in its short-term outlook. $0.02380 at the lower demand area was broken and TRXUSD dropped to $0.02277 a critical zone on 2nd March. The bears kept pushing the cryptocurrency down to $0.02290 in the demand area.
The key zone was retested after today’s opening before a final break at the third touch with a large bearish engulfing candle. This zone became a critical supply zone as TRXUSD dropped to $0.02175 in the demand area.
The stochastic oscillator signal points up at the oversold region at 16% an indication of brief upward momentum in the short-term before the bears’ downtrend continuation in the short-term.
The views and opinions expressed here do not reflect that of CryptoGlobe.com and do not constitute financial advice. Always do your own research.


