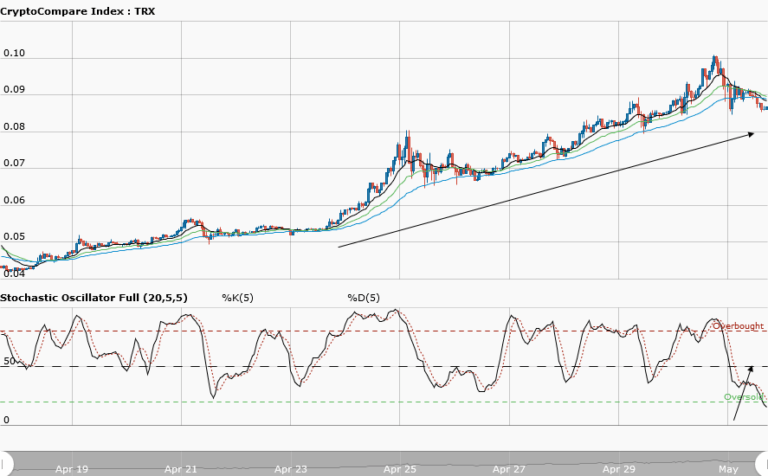

TRONIX Medium-term Trend: Bearish
Supply zones: $0.09000, $0.1000, $0.1100
Demand zones: $0.0500, $0.0400, $0.0300
Tronix continues its downtrend in the medium-term. The bears maintain their control of the market with a new low at the demand area just as the bulls lost momentum. The $0.08000 demand zone was nicely broken and the price was pushed down to the demand area at $0.07808. The downward trendline witnessed a bounce when the price was pushed up by the bulls, as clearly seen in the chart above. The price is below the three exponential moving average crossover and the moving averages are fanned apart. These further suggests a strong downward pressure and trend. A rejection to the upside momentum is seen in the stochastic oscillator, which suggests more downward momentum. The bears are likely to take Tronix to April 28th demand zone at $0.07500 in the medium term.
TRONIX Short-term Trend: Bearish

Tronix is bearish in the short-term. The bears succeeded in breaking the price down from yesterday’s lower range ($0.07900) as they establish their dominance in the market. The bulls gradually lost the momentum as they dove the price to the supply area at $0.08400, with the formation of a bearish pin bar. Subsequently, an upward move was rejected at this supply area and this brought in more sellers. The price was dragged down to the $0.07800 demand area. The stochastic oscillator is pointing down, meaning a momentum to the downside is expected in the pair. Patience is key as it paid off trading the breakdown from the range.
The views and opinions expressed here do not reflect that of CryptoGlobe.com and do not constitute financial advice. Always do your own research.