
In July, Bitcoin (BTC) had an extremely important, if not massive breakout from a multi-year downtrend. All bets are now off, with the leading crypto steaming up – in the long term anyway. In the shorter term, it may be time for some consolidation.
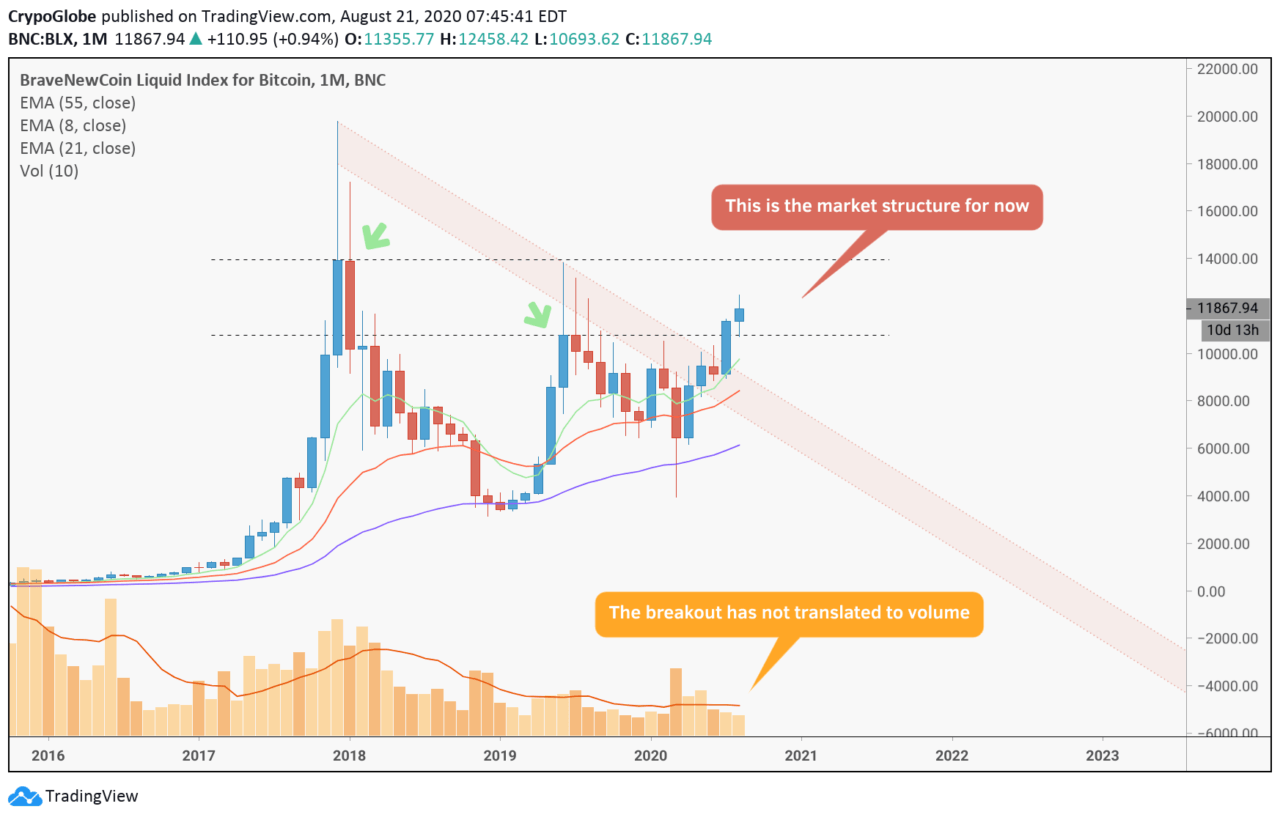
We start on the monthly chart, and see a general range drawn by candle bodies between $14,000 and $11,000. We should note that despite the July breakout’s importance technically, relatively little volume accompanied the event.
Coming way down to the 4-hour chart, we see the micro view of a shallow uptrending channel about to break to the downside. At minimum, we are likely to see some wicks down to about $11.5k, even if the channel ends up holding.
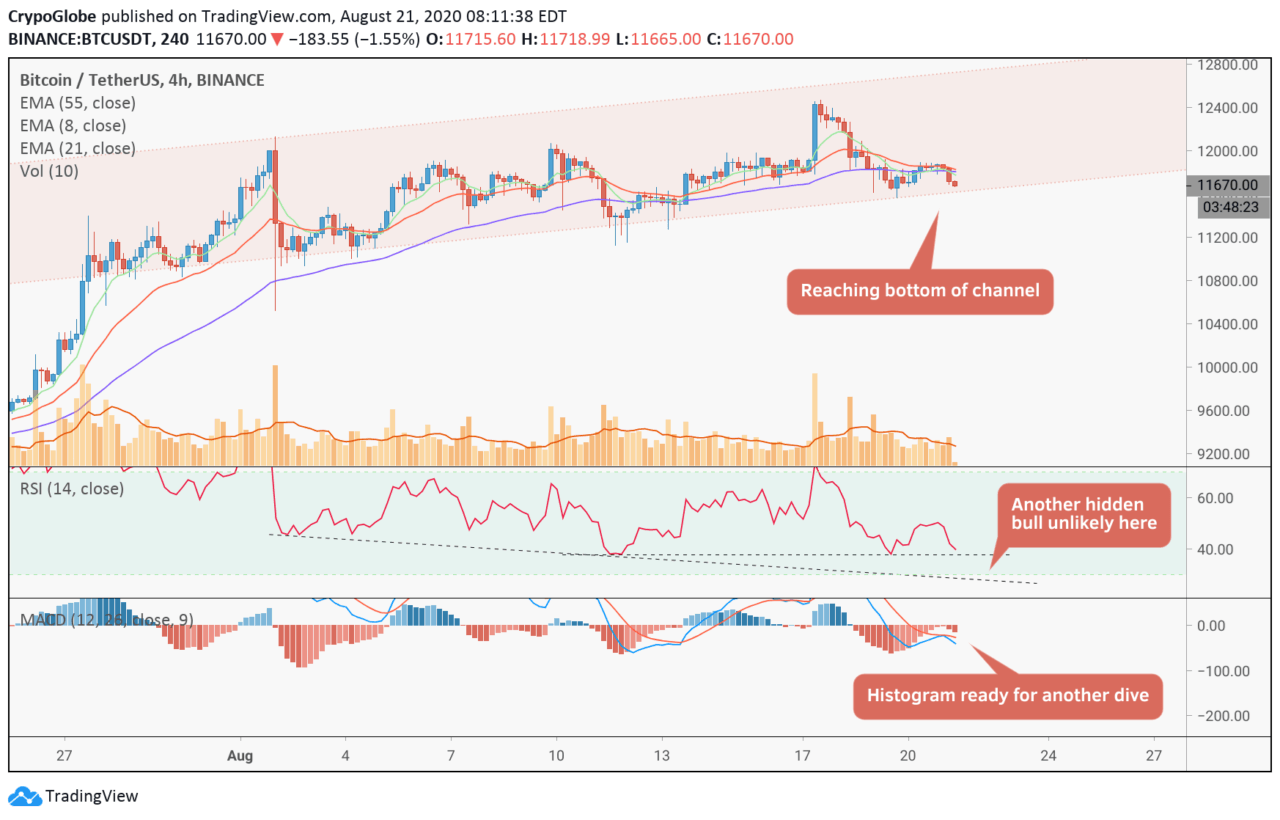
The histogram looks like it wants another leg down, while the RSI is unlikely to see its third hidden bullish divergence given how little slack it has.
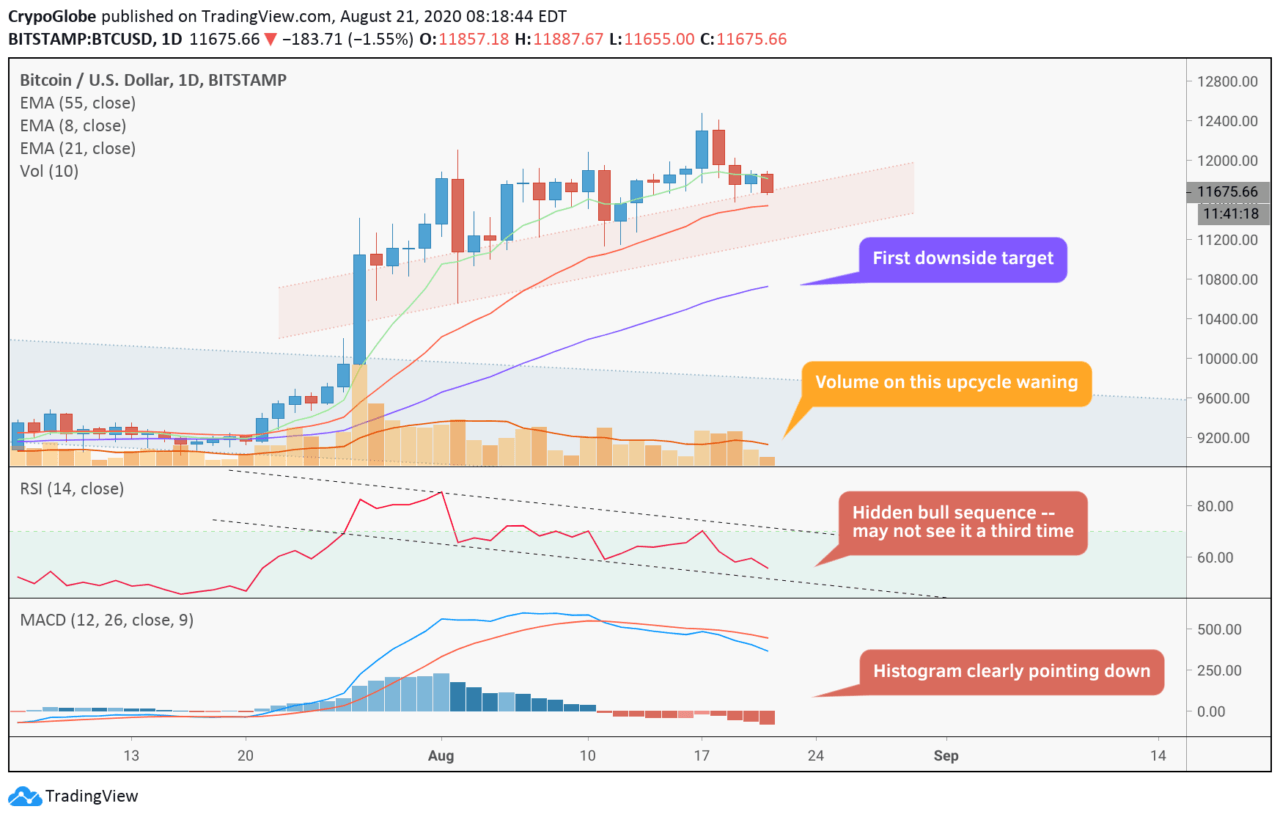
Moving to the daily chart, we see that price has edged ever closer to the 21 EMA after having broken the 8. In the event of a breakdown, the obvious first level of support we will find is the 55 EMA, at about $10,800.
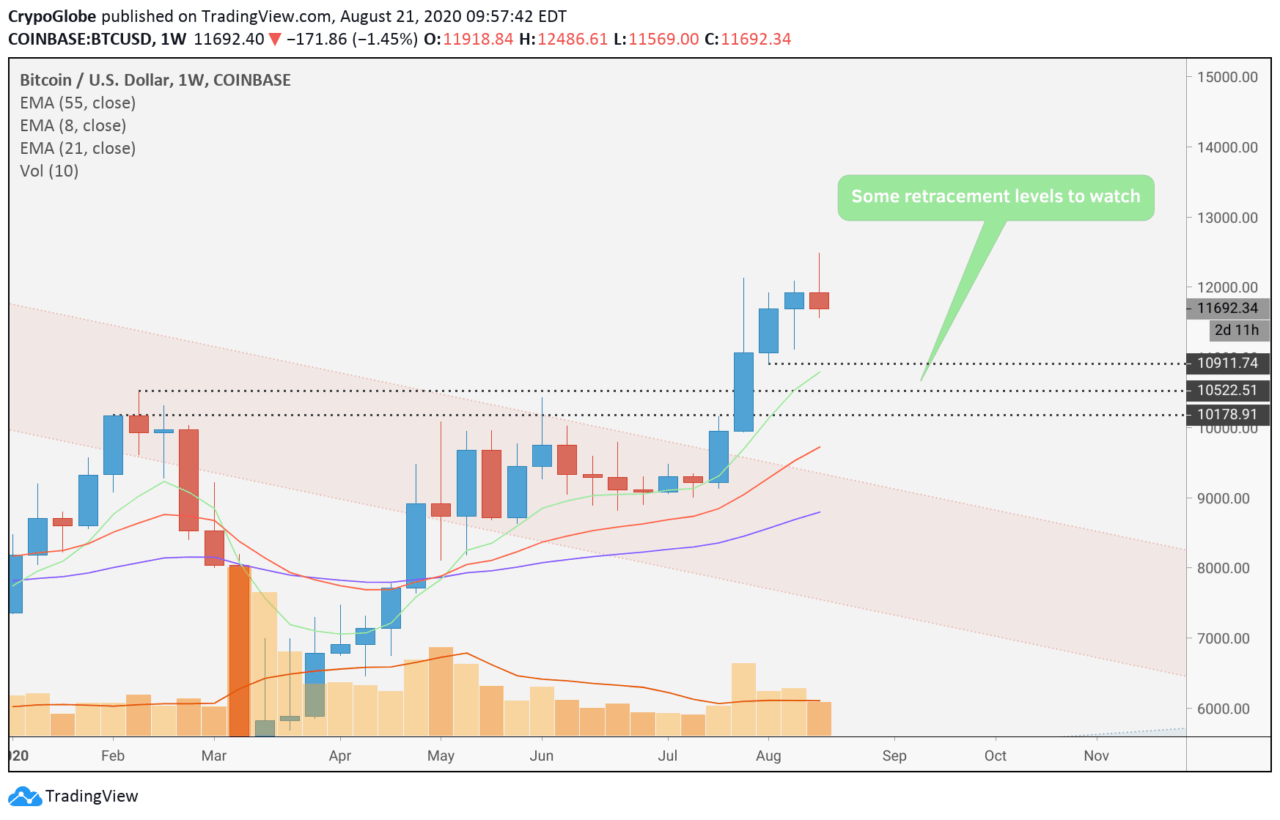
Finally, on the weekly chart, we see some retracement levels to watch, making a roughly $800 bock of a retracement target between $10.9-1k.
If we do see this retracement, it will be counted as a likely consolidation and preparation for a longer-term uptrend that we could see heading out of 2020. To be clear, the massive downtrend was obliterated in July, and that fact will stick on the chart all the way down to $8k if necessary.
The views and opinions expressed here do not reflect those of CryptoGlobe.com and do not constitute financial advice. Always do your own research.
Featured Image Credit: Photo via Pixabay.com