

XRPUSD Medium-term Trend: Bullish
- Resistance Levels: $0.56, $0.58, $ 0.60
- Support Levels: $0.30, $0.28, $0.26
The XRPUSD pair is now in the bullish trend zone. Yesterday, it was assumed that a price breakout will enable the bulls to break the $0.32 and $0.33 resistance levels. Today, the crypto’s price encountered a price breakout that has broken the resistance levels of $ 0.31, $0.32 and $0.33 price level.
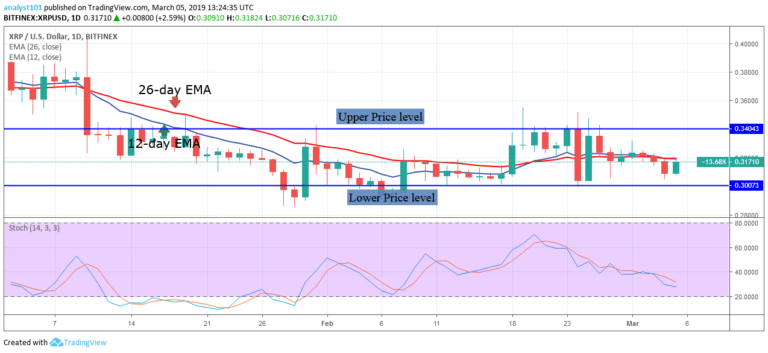
The crypto’s price is above 12-day EMA and the 26-day EMA which makes it possible for the crypto to rise. The XRP price is currently trading at $0.34028 as at the time of writing. On the upside, if the bulls defend the $0.33 price level and the buyers push the price above the $0.34 price level; XRP price will rise to the $0.40 price level.
Meanwhile, the stochastic indicator is at the oversold region but above the 40 % range.This indicates that the XRP price is in a bullish momentum and a buy signal.
XRPUSD Short-term Trend: Bullish

On the 4-hour chart, the XRP price is in a bullish trend zone. The 12-day EMA and the 26-day EMA are trending horizontally as a single line indicating that the XRP price was previously ranging at the $0.31 price level for days. Today, the XRP price has broken out of the range bound movement. The crypto’s price has a price spike that reached a high of $0.33.
The crypto’s price is likely to rise as the bulls have broken the $0.32 and $0.33 resistance levels. Nevertheless, the bullish trend is ongoing as the trend line has not been broken by a bearish candlestick. Meanwhile, the stochastic indicator is at the overbought region but above the 60 % range which indicates that the XRP price is in a bullish momentum and a buy signal.
The views and opinions expressed here do not reflect that of CryptoGlobe.com and do not constitute financial advice. Always do your own research. .


