
XRPUSD Medium-term Trend: Bullish
- Resistance Levels: $0.56, $0.58, $ 0.60
- Support Levels: $0.35, $0.33, $0.31
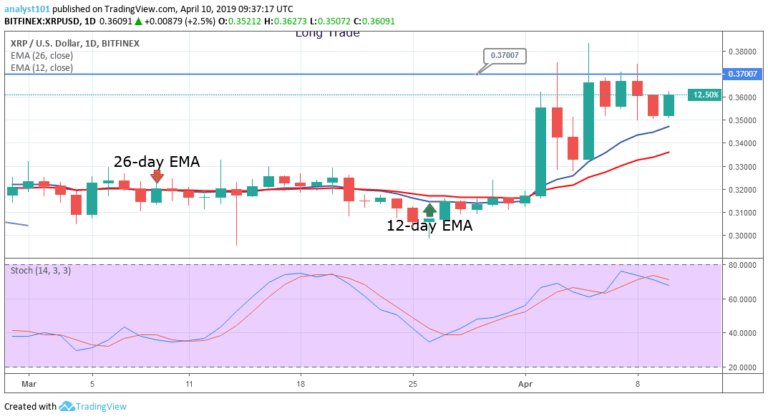
Yesterday, April 9, the XRP price was in a bearish trend. The bearish trend was terminated as the price fell to a low at $0.35033. The crypto’s price fell to the support at $0.35000 price level. It was assumed that if the price had broken the $0.35000 price level, the crypto’s price would have fallen to either the $0.33 or $0.34 price level.
Today, the XRP price is trading at $0.36079 and approaching the $0.37 resistance level. On the upside, if the bulls sustain a price above the 12-day EMA and the 26-day EMA, the $0.37 resistance level will be broken. Then our expectation at the $0.40 price level would be achieved.
Meanwhile, the stochastic is in the overbought region but above the 60% range. This indicates that the XRP price is in a bullish momentum and a buy signal.
XRPUSD Short-term Trend: Bullish

On the 4-hour chart, the XRP price is in a bullish trend zone. Yesterday, April 9, the bears broke the 12-day EMA and the 26-day EMA to reach the bearish trend zone. The crypto’s price fell to a low at $0.35360 and commenced a range bound movement.
It was assumed that if the bulls break above the EMAs, the crypto’s price might likely retest the 0.37 price level. The bulls have tested the $0.37 resistance level for the fifth times. This made the resistance level to be strong and a breakout would be powerful.
On the upside, if the bulls break the $0.37 resistance level, the momentum of price will increase and the price may rally above the $0.40 price level. Meanwhile, the stochastic indicator is in the oversold region but above the 20% range which indicates that the XRP price is in a bullish momentum and a buy signal.
The views and opinions expressed here do not reflect that of CryptoGlobe.com and do not constitute financial advice. Always do your own research.