

XRPUSD Medium-term Trend: Bullish
- Resistance Levels: $0.56, $0.58, $ 0.60
- Support Levels: $0.30, $0.28, $0.26
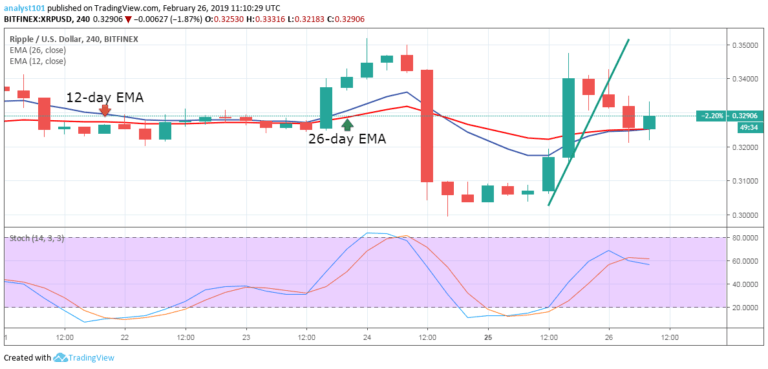
XRP is now in the bullish trend. Yesterday, it was assumed that its price would reach a bullish trend if the bulls managed to break its 12-day and 26-day EMAs. The crypto’s price was above the indicators and the bulls have been trading above the $0.31 level in the last 48 hours.
The $0.31 level was sustained as buyers emerged at that price level. The bulls can overcome the $0.33 and $0.34 levels if the price remains above both EMAs. More buyers should emerge at these price levels.
On March 1, the bulls were repelled after testing the $0.33 level. The downward trend lasted until a low at $0.30 was reached. Meanwhile, the Stochastic indicator is out of the overbought region but below 80 which indicates that XRP is facing bearish momentum, and is a sell signal.
XRPUSD Short-term Trend: Bullish

On the 1-hour chart, XRP is in a bullish trend. The bears have broken the below the 12-day EMA but the crypto’s price is trending above the 26-day EMA.
The Stochastic indicator is out of the oversold region but above 20 which indicates that XRP is in a bullish momentum and is a buy signal.
The views and opinions expressed here do not reflect that of CryptoGlobe.com and do not constitute financial advice. Always do your own research.


