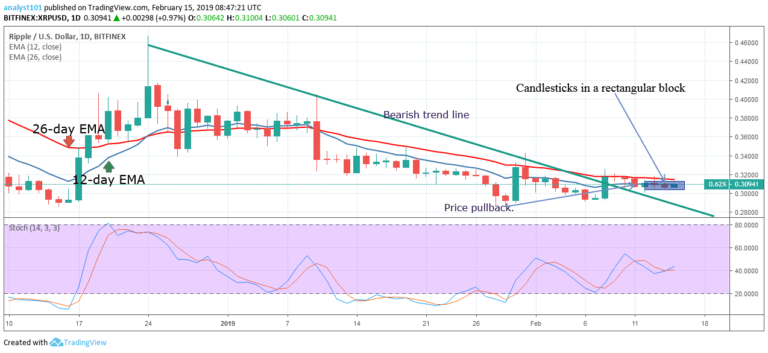
XRPUSD Medium-term Trend: Bearish
- Resistance Levels: $0.56, $0.58, $ 0.60
- Support Levels: $0.30, $0.28, $0.26
Last week, the price of XRP was in a tight range between the levels of $0.30 and $0.33. The bulls made an effort to break the $0.32 resistance level but failed. The 12-day EMA and the 26-day EMA indicate its price is trading within the range.
On March 21, the bears broke the EMAs to form a bearish trend. The crypto’s price has fallen to a low of $0.30983 as a consequence. A bearish trend line has been drawn to determine the duration of the trend. The price of XRP is likely going to depreciate in the near future.
XRP is expected to fall to a low of $0.30. If price tests $0.30 it may find support there and hold, but nevertheless if a bullish candlestick breaks the trend we could the bearish movement end in the near future.
Currently, Stochastic indicator is in overbought region but below 60 which indicates that XRP is in bearish momentum and is a sell signal.
XRPUSD Short-term Trend: Bearish
On the 4-hour chart, XRP is in a bearish trend. Last week, it was trading within a range as the bulls were looking to test resistance levels. Each time they tested the $0.32 resistance, the crypto’s price would fall and find support at its EMAs.
On March 21, the bears broke the EMAs’ support. The crypto’s price is now fluctuating below the 12-day EMA which is acting as a resistance. The Stochastic indicator is in the oversold region but below 40 which indicates the XRP is in bearish momentum and is a sell signal.
The views and opinions expressed here do not reflect that of CryptoGlobe.com and do not constitute financial advice. Always do your own research.


