

XRPUSD Medium-term Trend: Ranging
- Resistance Levels: $0.56, $0.58, $ 0.60
- Support Levels: $0.30, $0.28, $0.26
Yesterday, March 11, the XRP price was in a bearish trend while in a tight range between the levels of $0.30 and $0.33. On March 10, the bulls tested the $0.32500 resistance level and the price made a downward correction to the low at $0.31. The XRP price is now commencing a bullish movement to the $0.33 upper price level.
The downward range bound movement has been completed as the crypto resumed its upward movement to the upper price level. Traders can initiate long trades and exit near the upper price level. On the upside, the bulls are likely to break above the EMAs and retest the $0.32 and $0.33 price levels.
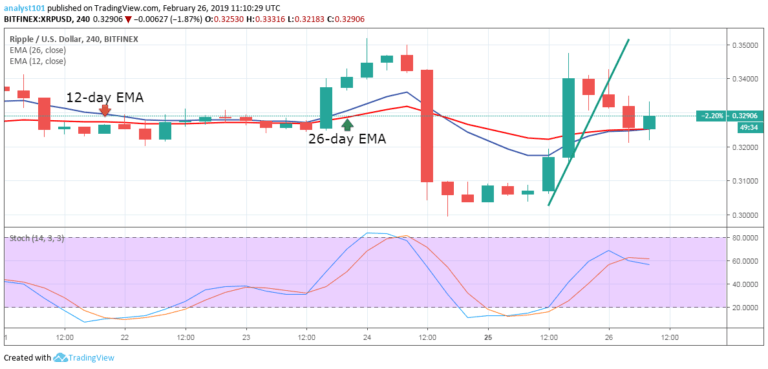
On the downside, if the bulls fail to break the EMAs, the crypto’s price will fall. Meanwhile, the stochastic indicator is at the oversold region but above the 20 % range which indicates that the XRP price is in a bullish momentum and a buy signal.
XRPUSD Short-term Trend: Bullish

On the 1-hour chart, the XRP price is in a bullish trend. The crypto’s price is making a series of higher highs and higher lows. A trend line has been drawn to determine the duration of the trend. For now, the bullish trend is ongoing because the trend line is unbroken.
The bullish trend is said to be terminated when price breaks the trend line and the following candlestick closes on the opposite of it. The price of XRP is trading at $0.31 as at the time of writing. Meanwhile, the stochastic indicator is at the overbought region but below the 80% range which indicates that the XRP price is in a bullish momentum and a buy signal.
The views and opinions expressed here do not reflect that of CryptoGlobe.com and do not constitute financial advice. Always do your own research.


