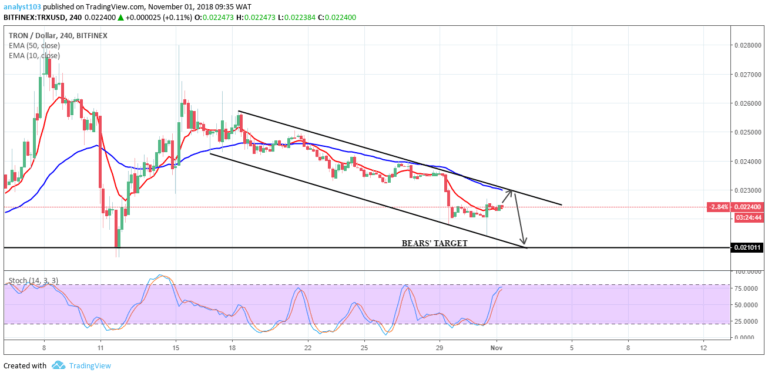
TRX/USD Medium-term Trend: Ranging
- Supply zones: $0.04000, $0.05000, $0.06000
- Demand zones: $0.01000, $0.00900, $0.00800
TRON ‘s TRX is back in a range-bound situation in its medium-term outlook. Strong bearish pressure saw the price of TRX drop to $0.02103 in the demand area on March 4. The formation of a pin bar at the demand area was a sign of reversal and of exhaustion.
The bulls’ return was signaled by a breakout at the 10-EMA at $0.02349. Increased momentum pushed TRX back in the range before the close of yesterday’s trading session at $0.02455, in the supply area.
Although today’s opening candle at $0.02433 is a bearish marubozu candle, TRX managed to only drop to $0.02370 as the bullish pressure remains strong and upward price movement within the range is probable.
TRX is consolidating and trading between $0.02541 in the upper supply area and $0.02362 in the lower demand area of the range. A breakout may be considered for a long position, while a breakdown may be good for a short position.
TRX/USD Short-term Trend: Ranging
In its short-term outlook, TRX is consolidating. Its bullish momentum was sustained with a bullish marubozu candle inside the range at $0.0235. Its price is above the two EMAs and the Stochastic Oscillator signal is at 29 pointing up, indicating upward bullish momentum is occurring in the near future.
The $0.02525 is the upper area of its price range while the $0.02380 mark is the lower area. A breakout or a breakdown may occur, and as such patience is required before entering a position.
The views and opinions expressed here do not reflect that of CryptoGlobe.com and do not constitute financial advice. Always do your own research.


