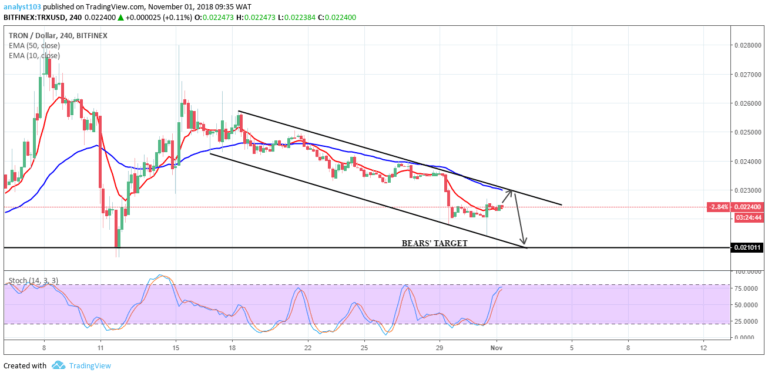
TRX/USD Medium-term Trend: Bearish
- Supply zones: $0.04000, $0.05000, $0.06000
- Demand zones: $0.01000, $0.00900, $0.00800
TRON is in a bearish trend in its medium-term outlook. The bearish pressure was sustained with the 50.0 fib area at $0.02262 in the demand area predicted on 8th March and further dropped to $0.02255. The weekend witnessed a bullish pullback to $0.02360 in the supply area but exhaustion set in late yesterday.
The bearish hammer of today’s 4-hour opening candle at $0.02330 signaled the bears returned. TRXUSD is already retested the 50-fib at $0.02275.
With the price below the two EMAs with a large engulfing candle and stochastic oscillator signal points down at 57%. It suggests downward momentum in price in the medium-term with the bears’ pressure stronger and more candles formed and closed below the EMAs.
The 61.8 or 78.2 fib areas at $0.02237 and $0.02178 respectively in the demand area are on the card for a retest.
TRX/USD Short-term Trend: Bearish
The cryptocurrency continues in a bearish trend in its short-term outlook. The push of price to $0.02337 in the supply area created the triple top formation. This implies a rejection of upward price movement at the supply area just as a bearish marubozu candle was formed after today’s 1hour opening candle at $0.02330.
The price lies below the two EMAs with the stochastic oscillator pointing down at 28%. These suggest downward momentum I price with a target at $0.02250 in the demand area in the short-term.
The views and opinions expressed here do not reflect that of CryptoGlobe.com and do not constitute financial advice. Always do your own research.


