

LTCUSD Medium-term Trend: Bullish
- Resistance Levels: $60, $65, $70
- Support Levels: $40, $35, $30
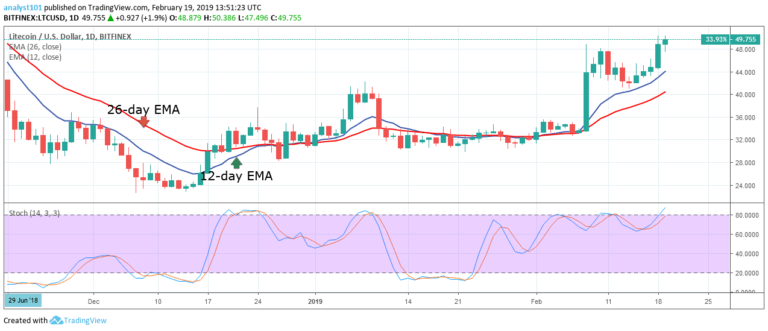
The price of Litecoin is in a bullish trend. The LTC price has reached its high but it is facing resistance at the $55 price level. On February 20, the bulls reached a high of $53.79 but the crypto’s price made a downward correction. On February 23, the bulls reached a high of $53.43 but the bears pulled the price back to the support of 12-day EMA.
Today, the bulls are making a third attempt to break the $55 resistance level. On the upside, if the bulls fail to break the resistance level, the crypto’s price is likely to fall. Meanwhile, the Stochastic is out of the overbought region but above the 40% range which indicates that the crypto is in a bullish momentum and a buy signal.
LTCUSD Short-term Trend: Bullish

On the 1-hour chart, the price of Litecoin is in a bullish trend. The price of Litecoin is making a series of higher highs and higher lows. The bullish trend is ongoing at the time of writing. Presently, the price is retracing from the recent high. If the bearish candlestick breaks the bullish trend line, the bullish trend is technically said to be terminated.
The assumption is that if price breaks the trend line and the following candlestick closed on the opposite of the trend line, the current trend is said to be terminated. Meanwhile, the Stochastic is in the overbought region and above the 80% range which indicates that the crypto is in a strong bullish momentum and a buy signal.
The views and opinions expressed here do not reflect that of CryptoGlobe.com and do not constitute financial advice. Always do your own research.


