

XRPUSD Medium-term Trend: Bearish
- Resistance Levels: $0.56, $0.58, $ 0.60
- Support Levels: $0.27, $0.25, $0.23
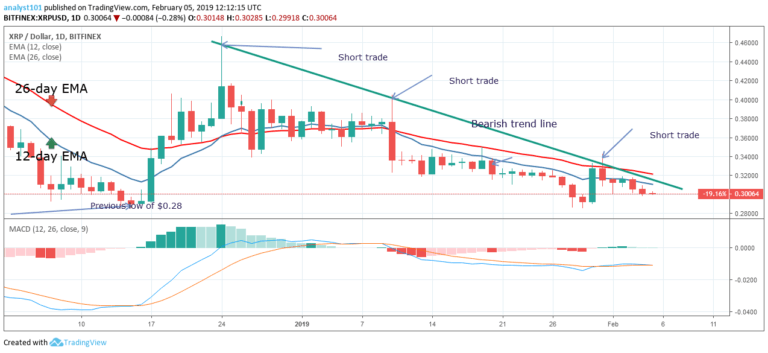
The XRP price has continued to sustain its bearish pattern. From the price action, the trend line indicates that the bearish trend is ongoing. On January 31, a bearish candlestick tested the trend line, and the crypto’s price continued its downward fall.The pointed arrows are resistance levels where a trader ought to initiate short trades.
Presently, the crypto’s price is approaching the previous low at $0.29 price level. On the upside, a trader can initiate a long trade if a bullish candlestick breaks the trend line and the following candlestick closed on the opposite of it. In this case, the bearish trend is said to be terminated. However, in the mean time we are still in a bearish trend.
Meanwhile, the stochastic band is out of the oversold region, but below the 40% range. This indicates that the price is in a bearish momentum and a sell signal.
XRPUSD Short-term Trend: Bearish

On the 4-hour chart, the XRP price is in the bearish trend zone. Yesterday, the bulls broke the 12-day EMA but were resisted by the 26-day EMA. This resulted in the crypto falling into the low at $0.29 price level. Meanwhile, the XRP price is below the EMAs which indicates that the price is likely to fall. Also, the stochastic has reached the oversold region and below the 20% range. This indicates that the XRP price is in a strong bearish momentum and a sell signal.
The views and opinions expressed here do not reflect that of CryptoGlobe.com and do not constitute financial advice. Always do your own research.


