

XRPUSD Medium-term Trend: Bullish
- Resistance Levels: $0.56, $0.58, $ 0.60
- Support Levels: $0.30, $0.28, $0.26
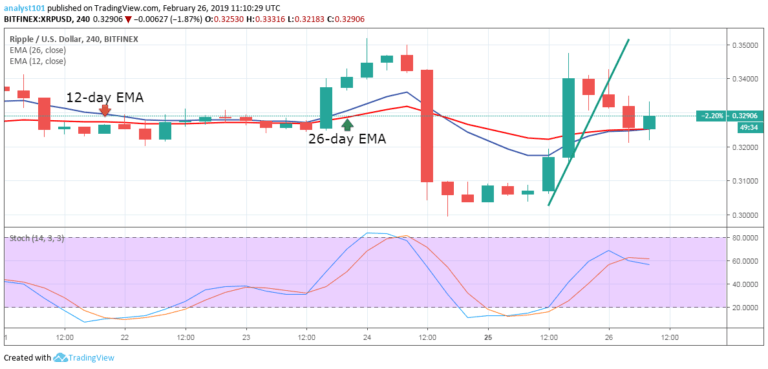
The XRPUSD pair was in a bullish trend zone. Yesterday, February 25, the crypto’s price fell to the low of $0.30 and commenced a range bound movement. The bulls took control of price and broke 12-day EMA and the 26-day EMA to reach the bullish trend zone.The crypto’s price reached the $0.34 price level but was resisted again.
The trend line that was drawn was broken by the bearish candlesticks terminating the bullish trend. On the upside, the crypto’s price will rise and break the resistance level if we have more buyers are introduced at the $0.34 price level. In addition, the crypto’s price should be sustained above the EMAs.
On the downside, if the bears break below the EMAs, the crypto‘s price will fall and find support at the $0.30 price level. Meanwhile, the stochastic indicator is out of the oversold region and but above the 60 % range which indicates that the XRP price is in a bullish momentum and a buy signal.
XRPUSD Short-term Trend: Bearish

On the 1-hour chart, the XRP price is in a bearish trend. The bearish trend is ongoing because the trend line is yet to be broken. The bearish trend line was formed by the bullish candlestick of February 25. A bearish candlestick tested the trend line and was resisted. From the bearish trend line, it is likely that the crypto’s price is likely to fall.
However, if the trend line is broken and the following candlestick closed on the opposite of it; it is assumed that bearish trend is terminated. Meanwhile, the stochastic indicator is in the oversold region but above the 20 % range which indicates that the XRP price is in a bullish momentum and a buy signal.
The views and opinions expressed here do not reflect that of CryptoGlobe.com and do not constitute financial advice. Always do your own research.


