

XRPUSD Medium-term Trend: Bearish
- Resistance Levels: $0.56, $0.58, $ 0.60
- Support Levels: $0.27, $0.25, $0.23
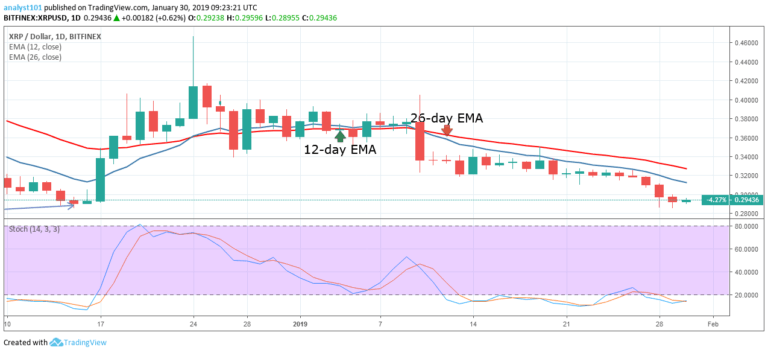
The XRP price is still in the bearish trend zone. On January 28, the crypto’s price fell to the $0.29 price level. However, the crypto is stable at $0.29 after testing the $0.28 price level. From the daily chart, the crypto’s price is below the 12-day EMA and the 26-day EMA which indicates that the bearish trend is not over.
Secondly, the XRP price is in the oversold region of the stochastic indicator and below the 20% range. This indicates that XRP price is in a strong bearish momentum and a sell signal. Nevertheless, on the downside, if the bears continue its downtrend, the crypto will revisit the September 11 low of $0.26.
On the upside, the crypto will first break the EMAs and the price is sustained above the $0.33 price level.Then the XRP price will resume its bullish trend.
XRPUSD Short-term Trend: Bearish

On the 4-hour chart, the XRP price is in the bearish trend zone. On January 29, the XRP price fell to its previous low at $0.28 as already suggested in the previous analysis. Today, the bulls have taken price to the 12-day EMA and the 26-day EMA. The bulls are yet to break the EMAs and the crypto’s price is below the EMAs which indicates that XRP is likely to fall.
Meanwhile, the stochastic indicator is out of the oversold region but above the 20% range which indicates that the price is in a bullish momentum and a buy signal.
The views and opinions expressed here do not reflect that of CryptoGlobe.com and do not constitute financial advice. Always do your own research.


