

XRPUSD Medium-term Trend: Ranging
Resistance Levels: $0.56, $0.58, $ 0.60
Support Levels: $0.34, $0.32, $0.30
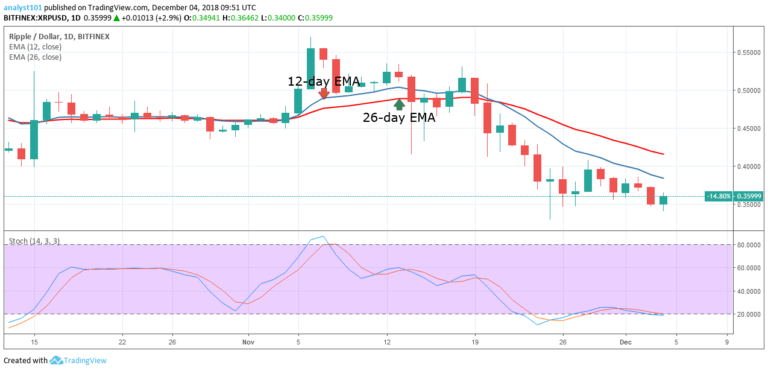
Since November 25, XRP’s price has been on a sideways trend. The cryptocurrency has been fluctuating between the $0.3 and $0.4 levels. On said day, its price fell to a $0.34 low, and entered a range-bound movement. The bears were unable to break through this level, while the bulls weren’t able to break through $0,.4.
Yesterday, the bears tested the range’s low end, but the bulls fought back. The cryptocurrency’s price is currently below the 12-day EMA and the 26-day EMA which indicates it’ll likely keep dropping. The Stochastic Oscillator is above range 20, which indicates bearish momentum is taking it into the oversold territory.
XRPUSD Short-term Trend: Ranging

On the short-term, XRP is in a sideways trend. Yesterday, its price fell to a low of $0.34 and started a bullish movement. The bulls have been resisted at the 12-day EMA and the price is now falling to a lower price level. This has been the scenario since November 25. If the bears break the $0.34 price level, the crypto to fall to the previous low of $0.28.
On the other hand, if the bulls are in control, the digital currency will face resistance at the $0.40 level.
The views opinions expressed here do not reflect that of CryptoGlobe.com and do not constitute financial advice. Always do your own research.


