

XRPUSD Medium-term Trend: Ranging
- Resistance Levels: $0.56, $0.58, $ 0.60
- Support Levels: $0.30, $0.28, $0.26
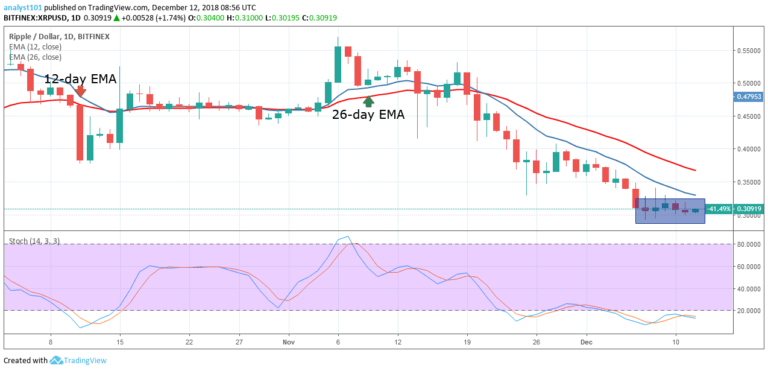
The XRPUSD pair is in a sideways trend as the crypto continues to remain in the bearish trend zone. The XRP price declined to the low of $0.30 and continued in a range bound movement. It is likely that the XRP price will further depreciate as the crypto’s price is below the 12-day EMA and the 26-day EMA.
In addition, the Stochastic indicator is in the oversold region and stochastic bands are below the 20% range. This indicates that the crypto has a bearish momentum and a sell signal. Therefore, we expect the crypto to reach the lows of $0.28 and $0.24. On the upside, the crypto would trade higher if the 12-day EMA and the 26-day EMA are broken and the price remained in the bullish trend zone.
XRPUSD Short-term Trend: Ranging

On the short term trend, the XRP price is in a sideways trend. The crypto’s price is also in the bearish trend zone. At the lower time frame, the crypto fluctuates between the levels of $0.29 and $0.32. On December 9, the bulls were resisted and the price fell to the lower price range.
Also, on the 10th and 11th of December, the bears were resisted and the price commenced a bullish movement. Traders can trade this range bound movement pending the outcome of a price breakout.
The views opinions expressed here do not reflect that of CryptoGlobe.com and do not constitute financial advice. Always do your own research. .


