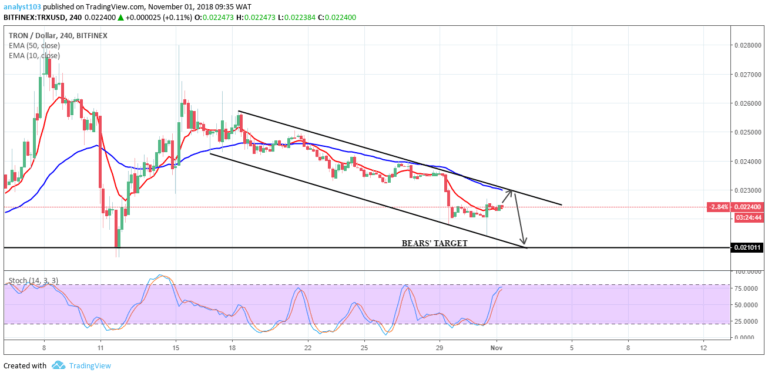
TRX/USD Medium-term Trend: Bearish
- Supply zones: $0.02500, $0.02600, $0.02700
- Demand zones: $0.01000, $0.00900, $0.00800
TRX continues in a bearish trend in its medium-term outlook. $0.1484 was retested yesterday as a market correction occurred with a brief upward movement. The price was at the 38.2 fib level – a trend continuation zone. The bears came back strong and ensured a lower low was attained yesterday as TRXUSD went down to $0.1396 in the demand area.
Shortly after today’s opening, the bearish momentum was sustained, TRXUSD dropped to $0.1364 in the supply area before the current bullish pullback that has the cryptocurrency at $0.1460 in the supply area.
The stochastic oscillator signal points down at 26% and the price is within the 38.2 fib level. It suggests a further drop in price due to the bears’ pressure in the medium-term.
TRX/USD Short-term Trend: Bearish
The cryptocurrency is in a bullish trend in its short-term outlook. The bears’ pressure was briefly lost after TRXUSD dropped to the low of the day at $0.01400 in the demand area before a pullback by the bulls to $0.01429 in the supply area.
$0.01364 in the demand area was retested after today’s opening – creating a double bottom formation. Confirmation to the bulls takeover was with a large bullish engulfing candle at $0.01390 as TRXUSD was up at $0.01458 the supply area.
With the price above the two EMAs and the stochastic oscillator signal pointing up at 56% it further confirms the upward momentum in price as the bullish becomes much stronger in the short-term.
The views and opinions expressed here do not reflect that of CryptoGlobe.com and do not constitute financial advice. Always do your own research


