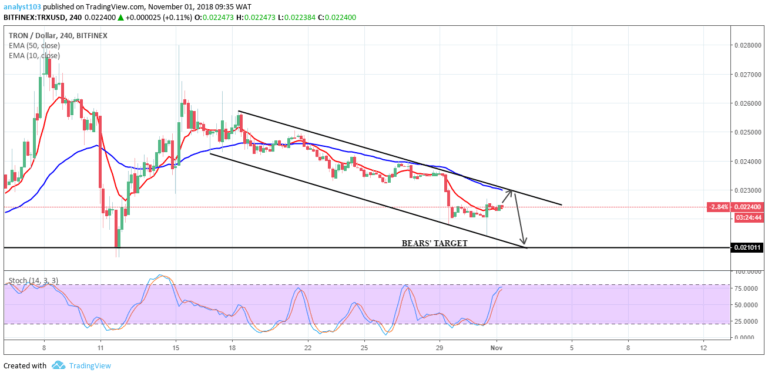
TRX/USD Medium-term Trend: Bearish
- Supply zones: $0.03000, $0.04000, $0.04500
- Demand zones: $0.01000, $0.00900, $0.00800
In the medium-term, TRON’s TRX is in a bearish trend. Strong bullish pressure weakened the cryptocurrency at the $0.024 mark after it got its daily high on December 24. A bearish inverted hammer then signaled the bears returned, and saw its price drop.
Later on a large bearish Marubozu confirmed the bears’ control as TRX slowly dropped to the $0.018 mark. The $0.021 was retested to confirm the crypto’s downward trend. Their medium-term target is the $0.018 mark.
TRX/USD Short-term Trend: Bearish
In the short-term, TRX’s outlook is still bearish. After a gradual bullish run earlier, a 1-hour opening candle saw its momentum go to $0.021 before exhaustion set in. TRX then dropped to $0.019 and is threatening to go lower.
Its price is currently below both EMAs and the stochastic oscillator points down at 17 which indicates a downward movement in price of the cryptocurrency in the short-term.
The views and opinions expressed here do not reflect that of CryptoGlobe.com and do not constitute financial advice. Always do your own research.


