 Litecoin Chart by Trading View
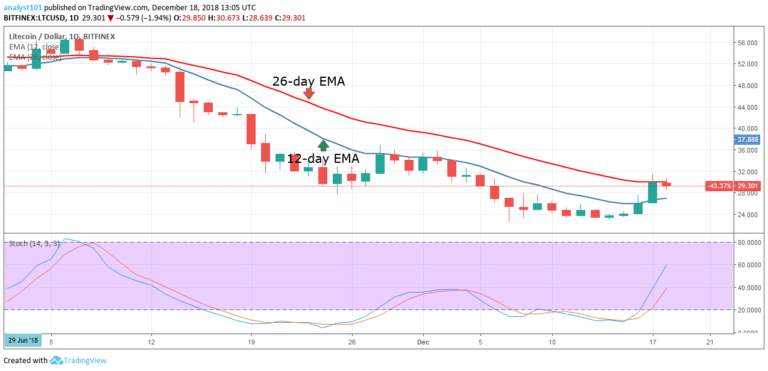
LTCUSD Medium-term Trend: Bearish
- Resistance Levels: $60, $65, $70
- Support Levels: $20, $15, $10
Yesterday, December 17, the LTCUSD pair was in a bullish trend. On December 13, the price of Litecoin fell to its low at a price of $23.47. The bullish trend commenced the following day and broke the 12-day EMA. The crypto reached the high of $29.88. However, it was resisted by the 26-day EMA. Today, the crypto’s price is in a bearish trend. It is likely that Litecoin will find support at its previous low.
This is because the overall trend is bearish.The 12-day EMA and the 26-day EMA are trending southward. The crypto’s price is below the 26-day EMA which has the tendency to fall. On the upside, if price breaks the 26-day EMA, the bulls will face resistance at the $0.35 price level.
LTCUSD Short-term Trend: Bullish
 Litecoin Chart by Trading View
On the 4-hour chart, the price of Litecoin is in a bearish trend. The price of Litecoin was making a series of higher highs and higher lows the previous day. From the chart, the bullish trend has been terminated because the price no longer follows the pattern of higher highs and higher lows. Secondly, once the trend line is broken the current trend is said to be reversed.
Therefore the LTC price is expected to fall. Meanwhile, the Stochastic is in the range below the 80% range. This means that the Stochastic is out of the overbought region and the bands are pointing downward indicating a downtrend. It also means that the LTC price has a bearish momentum and a sell signal.
The views and opinions expressed here do not reflect that of CryptoGlobe.com and do not constitute financial advice. Always do your own research.