 Ethereum Chart By Trading View
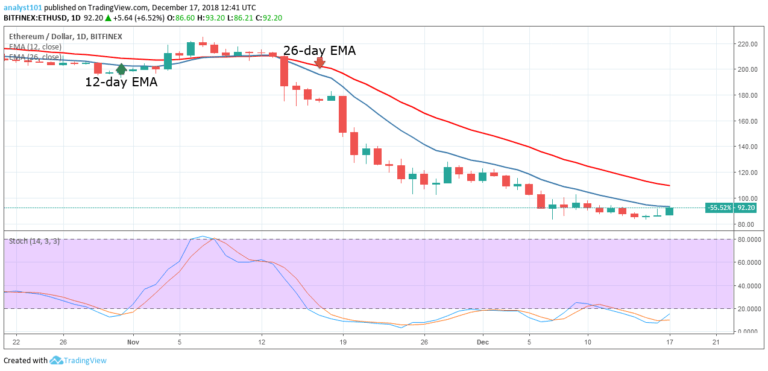
ETHUSD Medium-term Trend: Ranging
- Resistance Levels: $230, $240, $250
- Support Levels: $80, $70, $60
Last week the ETHUSD pair was still in a range bound movement. The crypto’s price is ranging between the levels of $83 and $91. The movement had been characterized by small body candlesticks. From the daily chart, the ETH price is below the 12-day EMA and the 26-day EMA which indicates that it is in the bearish trend zone.
The crypto’s price has a tendency to fall. The range bound movement will result in a price breakout which is being expected in the days to come. If price breaks below the $83 price level. the ETH price will find support between the lows of $75 and $80. On the upside, if price breaks the $91 price level, ETH price will reach the highs of $100 and $110
ETHUSD Short-term Trend: Ranging
 Ethereum Chart By Trading View
On the 4-Hour chart, the price of Ethereum is in a sideways trend. Last week the crypto’s price fell to its low at $83.17 and commenced a bullish movement. The crypto’s price broke the 12-day EMA, the 26-day EMA and reached the high of $88.80. Today, the ETH price is trading at $92.88 as at the time of writing.
Meanwhile, the Relative Strength Index period 14 is level 63 which indicates that the crypto’s price is in the bullish trend zone.
The views and opinions expressed here do not reflect that of CryptoGlobe.com and do not constitute financial advice. Always do your own research.