

ADAUSD Medium-term Trend: Bearish
- Resistance levels: $0.080, $0.090, $0.100
- Support levels: $0.030, $0.020, $0.010
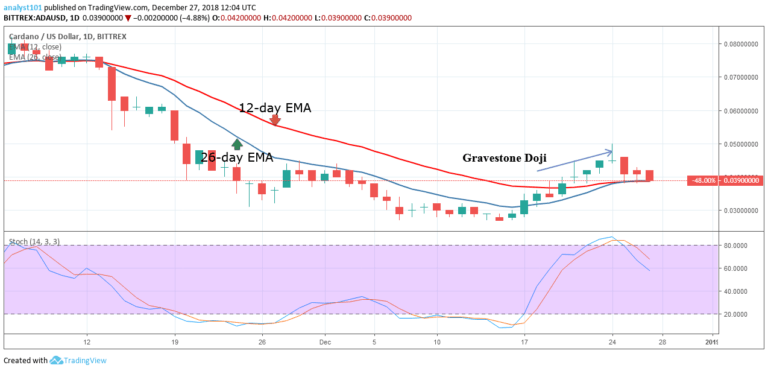
The price of Cardano had been under the control of bears and the bulls in the month of December 2018. The crypto had an opening balance of $0.0390 in the month of December. Presently, the crypto’s price is above the 12-day EMA and the 26-day EMA which indicates that the price is in the bullish trend zone. On December 24, the crypto’s price reached the high of $0.050 but was resisted.
A Gravestone Doji candlestick indicated the reversal of the uptrend. The crypto’s price is retracing from the recent high and approaching the low of $0.0390. On the downside, if the bears break the support at $0.0390 without a pullback, the crypto will further depreciate to the low of $0.35. On the other hand, if the bulls sustain hold at the $0.0390 price level, the crypto will rise to a previous high of $0.050.
ADAUSD Short-term Trend: Bearish

On the 4-hour chart, the crypto’s price is in a bearish trend. The crypto’s price is below the 12-day EMA and the 26-day EMA which indicates that price is likely to fall. Meanwhile, the Stochastic bands are approaching the oversold region below the 20% range. If the stochastic bands fall into the oversold region the crypto will be in a strong bearish momentum.
The views and opinions expressed here do not reflect that of CryptoGlobe.com and do not constitute financial advice. Always do your own research.


