

XRPUSD Medium-term Trend: Bearish
Resistance Levels: $0.56, $0.58, $ 0.60
Support Levels: $0.36, $0.34, $0.32
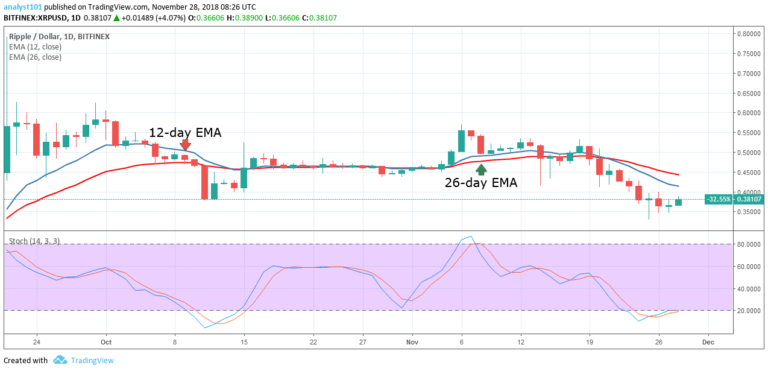
Yesterday, the XRPUSD pair was in a bearish trend and the price was approaching the $0.34 price level. It was suggested that if the bearish trend continued the digital currency will find support at the previous low of $0.24. Yesterday, the $0.35 price level was held and the crypto’s price was in a bullish trend approaching the price at $0.40. However, the crypto’s price is below the 12-day EMA and the 26-day EMA.
The bullish trend is confirmed by the Stochastic indicator which is in the range above 20. When the blue band of the Stochastic is above the red band and both are out the oversold region; this indicates a buy signal. The current bearish trend is also assumed to be reversed.
XRPUSD Short-term Trend: Bullish

On the short term trend, the XRP price is in a bullish trend. The price of the digital currency has broken the 12-day EMA, the 26-day EMA and is continuing in its bullish trend. In addition, the crypto’s price is likely to rise but may face resistance at the $0.40 price level. If the bulls fails to break the $0.40 price level, the digital currency will be range bound.
The views opinions expressed here do not reflect that of CryptoGlobe.com and do not constitute financial advice. Always do your own research.


