
XRPUSD Long-term Trend – Bearish
Distribution territories: $0.55, $0.60, $65
Accumulation territories: $0.25, $0.20, $0.15
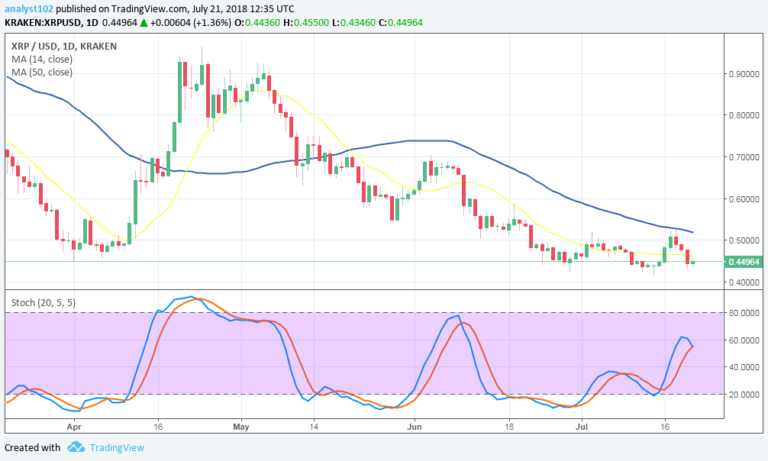
XRP has been under heavy selling pressure over the last few days. The cryptoasset first managed to push its price up on November 18 but it soon lost momentum, and as both its SMAs were broken southwards in the following day.

On November 21 XRP’s price moved in an erratic manner and on November 22 the crypto started maintaining a definite bearish movement that saw its price drip from about the $0.45 mark. The 14-day SMA touched the 50-day SMA.
The Stochastic Oscillators have dipped into the oversold zone. Currently, XRP is trading at around $0.35 and if this price is broken the crypto could revisit territories it saw on October 11, or even below those at $0.15.
Investors may choose to buy the crypto now or wait for it to dip a bit further.
The views and opinions expressed here do not reflect that of CryptoGlobe.com and do not constitute financial advice. Always do your own research.


