
TRXUSD Long-term Trend – Ranging
Distribution territories: $0.026, $0.030, $0.034
Accumulation territories: $0.014, $0.012, $0.010
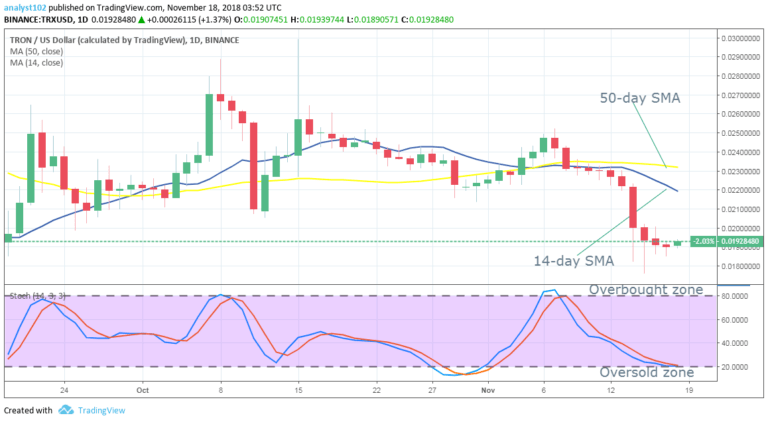
TRX’s most recent trading sessions have mostly been characterized by lower lows. In these recent sessions TRX lost some of its value to the US dollar, and was moving within a range between $0.026 and $0.022

The range was broken southwards after a bearish Japanese candlestick emerged on Nov. 14. At the time the cryptocurrency’s price dropped slightly below the $0.018 price territory. The 50-day SMA is located over the 14-day SMA and, they are both above TRX’s price line.
The Stochastic Oscillators have moved south to touch range 20. A bearish move can’t currently be ruled out, as the Stochastic Oscillators haven’t dipped into the oversold zone to warrant such an assumption.
The market may continue to see ranging movements around $0.018 in the next few trading sessions. However, the 14-day SMA should be breached northwards to substantiate the bulls’ return, aside from that, a fall to test the $0.014 may still occur.
The views and opinions expressed here do not reflect that of CryptoGlobe.com and do not constitute financial advice. Always do your own research.


