

ADAUSD Medium-term Trend: Bearish
Supply zones: $0.075, $0.080, $0.090
Demand zones: $0.065, $0.055, $0.045
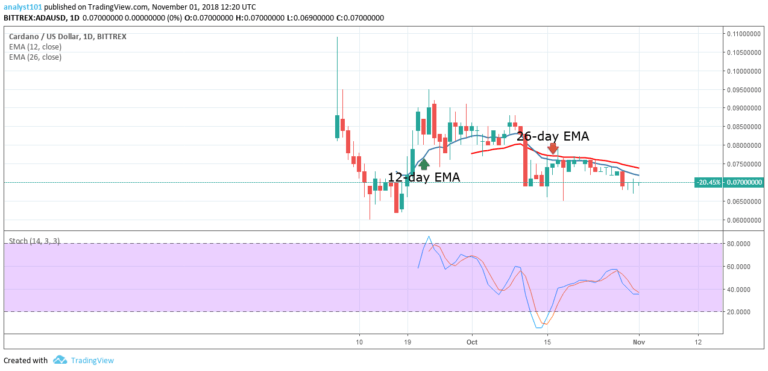
Yesterday, ADAUSD pair was in a sideways trend. The cryptocurrency had been in a bearish trend since October 11. On October 29, the 12-day EMA acted as resistance and the price of ADA fell to the current price of $0.0690. The price of ADA commenced a range bound movement above the price of $0.0690. The price of ADA is expected to fall again because it is in the bearish trend zone.
The Stochastic indicator is below 80 and approaching 40, the cryptocurrency is on a sell signal. The bears are in control as the price reached the previous low of $0.0690. If the bearish pressure continues the crypto’s price will reach the low of $0.0620. Meanwhile, the ADA price is below the 12-day EMA and the 26-day EMA which indicates that the price is in the bearish trend zone.
ADAUSD Short-term Trend: Bearish

On the short term trend, the price of ADA is in a bearish trend.The crypto’s price bars are below the 12-day EMA and the 26-day EMA which indicates that the price is in the bearish trend zone. Meanwhile, the Relative Strength Index period 14 is level 43 which indicates that the price of the crypto is in a sideways trend zone.
The views and opinions expressed here do not reflect that of CryptoGlobe.com and do not constitute financial advice. Always do your own research.


