

XRPUSD Medium-term Trend: Bearish
Resistance Levels: $0.59, $0.61, $ 0.63
Support Levels: $0.45, $0.43, $0.41
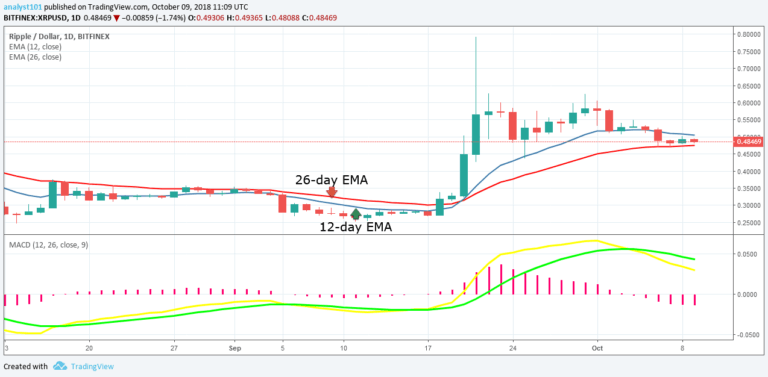
Yesterday, the XRPUSD pair was in a bearish trend. On September 30, the XRP price reached the high of $0.62 and was resisted. The cryptocurrency fell to its low at $0.48. The price reached the upper level of price range and was repelled because it was a resistance level. XRP is now at the lower level of the price range. The cryptocurrency now has a hurdle jump over at the resistance level of $ 0.50.
The XRP price has to break the $0.50 price level before it comes out of the lower level of price range. The price is fluctuating against the US dollar at the current price level. Nevertheless, the XRP price is neither below nor above the 12-day EMA and the 26-day EMA which indicates that price is in a sideways trend zone.
The MACD line and the signal line are above the zero line which indicates a buy signal.
XRPUSD Short-term Trend: Bearish

On the 4-hour chart, the XRP price is in a bearish trend. The XRP price is below the 12-day EMA and the 26-day which indicates that a bearish trend is ongoing. Nevertheless, the Relative Strength Index period 14 is level 42 which indicates that a sideways trend is ongoing.
The views and opinions expressed here do not reflect that of CryptoGlobe.com and do not constitute financial advice. Always do your own research.


