

XRPUSD Medium-term Trend: Ranging
Resistance Levels: $0.50, $0.52, $ 0.54
Support Levels: $0.40, $0.38, $0.36
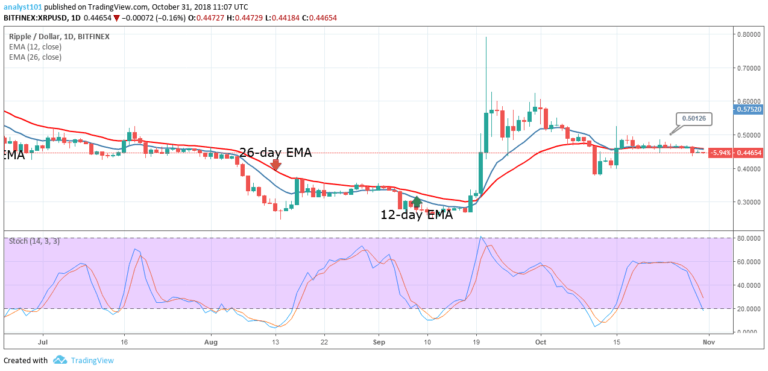
Yesterday, the XRPUSD pair was in a bearish trend. As the crypto’s price fell to the $0.44 price level, it commenced a range bound movement. From the price action, the digital currency is below the 12-day EMA and 26-day EMA which indicates that tje XRP price is in the bearish trend zone. The Stochastic indicator is approaching 20.
The momentum on the downside is getting stronger. However, if the XRP price falls from the current price level, the digital currency will find support at $0.38. On the upside, Since October 15, the crypto’s price had not been able to break the $0.50 price level. If the XRP price breaks the $0.50 price level, the digital currency will commence its uptrend movement.
XRPUSD Short-term Trend: Bearish

On the short term trend, the XRP price is in a bearish trend. The crypto’s price bars are below the 12-day EMA and 26-day EMA which indicates that the price is in the bearish trend zone. Meanwhile, the Relative Strength Index period 14 is level 40 which indicates that the crypto’s price is in a sideways trend zone.
The views and opinions expressed here do not reflect that of CryptoGlobe.com and do not constitute financial advice. Always do your own research.


