

XRPUSD Medium-term Trend: Ranging
Resistance Levels: $0.50, $0.52, $ 0.54
Support Levels: $0.40, $0.38, $0.36
Yesterday, the XRP price broke out of its range bound movement. The bears’ took price to the low of $0.44 and commenced a bullish movement. The bearish pressure is likely not over because the crypto’s price is below the exponential moving averages (EMAs) and the blue and red bands of the stochastic indicator are widening.
The implication is that the new bearish trend will continue as the momentum is on the downward trend. On the downside, if the price falls, the cryptocurrency find support at $0.38. On the upside, if the bulls take charge and the resistance at $0.48 is broken, the price will rise to the high of $0.56 and $0.60
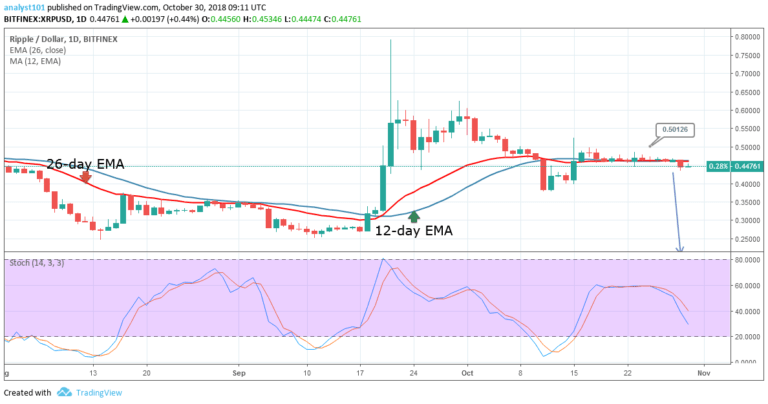
XRPUSD Short-term Trend: Bearish

On the short term trend, the XRP price is in a bearish trend. The crypto’s price fell to the low of $0.44 and commenced a range bound movement. The XRP price is below the 12-day EMA and the 26-day EMA which indicates that theprice is in the bearish trend zone. Meanwhile, the Relative Strength Index period 14 is level 37 which indicates that the XRP price is nearing the oversold region of the market.
The views and opinions expressed here do not reflect that of CryptoGlobe.com and do not constitute financial advice. Always do your own research.


