

XRPUSD Medium-term Trend: Ranging
Resistance Levels: $0.50, $0.52, $ 0.54
Support Levels: $0.40, $0.38, $0.36
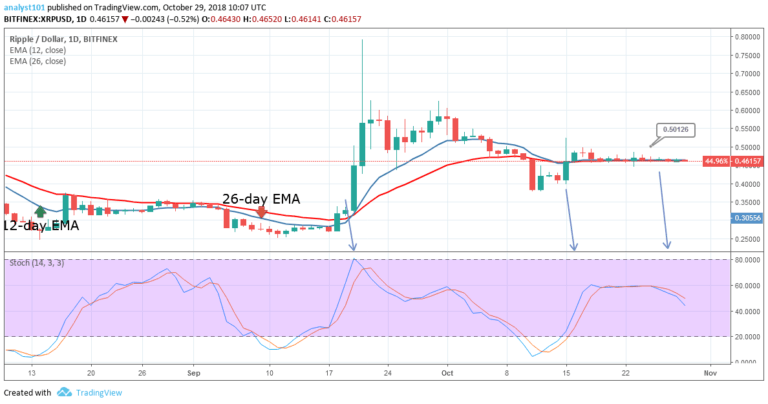
The XRPUSD pair was in a range bound movement above the price of $0.46 in the last one week. The price of the cryptocurrency is still the same today. As the cryptocurrency is range bound, there is the possibility of a price breakout. As you look at the current candlestick and then to the stochastic indicator, you will find that the blue and the red stochastic bands are widening.
While the price bars and EMAs are horizontally flat, the widening of the bands indicates that a new trend is about to commence. As the case of the price action on 20/10/18 and 15/10/18, the widening of the bands gave rise to bullish trends. A new trend is expected. Nevertheless, if the price breaks on the upside, the $0.50 price level would be broken and the price may attain a high of $0.60.
On the downside, the price will find support at $0.44
XRPUSD Short-term Trend: Ranging

On the short term trend, the XRP price is in a sideways trend.The XRP price, the 12-day EMA and the 26-day EMA are horizontally flat. Meanwhile, the Relative Strength Index period 14 is level 45 which indicates that the crypto’s price is in a sideways trend.
The views and opinions expressed here do not reflect that of CryptoGlobe.com and do not constitute financial advice. Always do your own research.


