

XRPUSD Medium-term Trend: Ranging
Resistance Levels: $0.50, $0.52, $ 0.54
Support Levels: $0.40, $0.38, $0.36
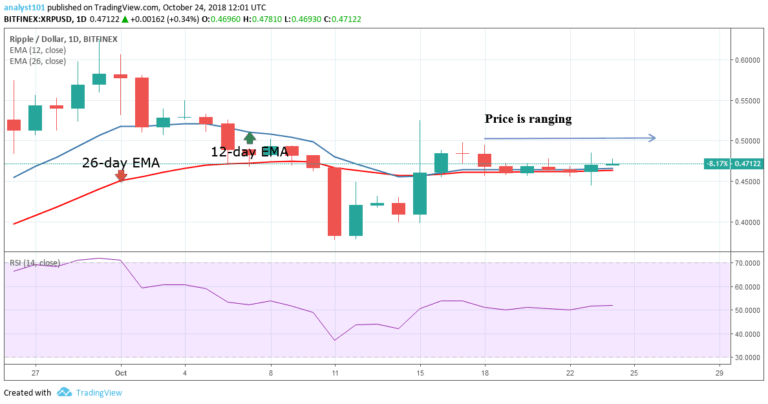
Yesterday, the XRP price was in a sideways trend. On October 16, the crypto was earlier in a bullish trend and the price reached a high of $0.48. The XRP price was resisted at $0.49 because the $0.50 price level was a resistance level. The price fell to the low of $0.46 and commenced a range bound movement. Today, the XRP price will continue its fluctuations above the $0.46 price level .
Meanwhile, the Relative Strength Index period 14 is level 52 which indicates that the crypto’s price is in a sideways trend.
XRPUSD Short-term Trend: Bullish

On the short term trend, the XRP price is in a bullish trend. Yesterday, the XRP price fell to the low of $0.44 after its inability to break the $0.50 price level. The bulls are in control as the price moves to the higher price level. The bulls are not likely to test the resistance at $0.50 because the price has broken the trend line and the following candlestick closing after it.
The crypto’s price was resisted and is now in a bearish trend. The XRP price is above the exponential moving averages (EMAs) indicating that the price is rising. Meanwhile, the Relative Strength Index period 14 is level 56 which indicates that the crypto’s price is in a sideways trend.
The views and opinions expressed here do not reflect that of CryptoGlobe.com and do not constitute financial advice. Always do your own research.


