

XRP Price Medium-term Trend: Ranging
Resistance Levels: $0.59, $0.61, $ 0.63
Support Levels: $0.54, $0.52, $0.49
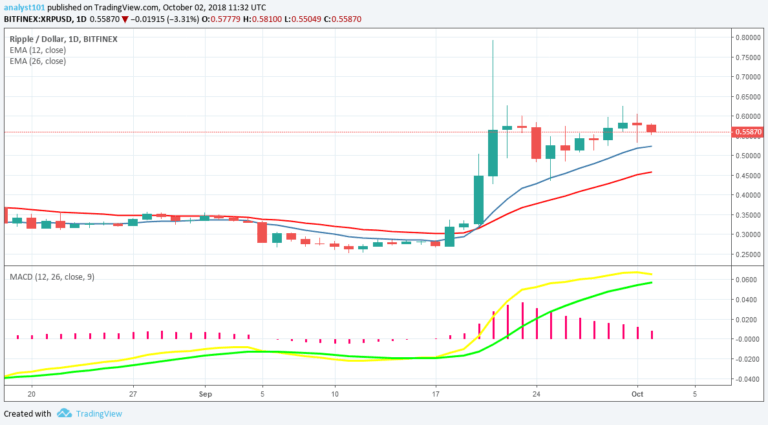
Yesterday, October 1, the XRPUSD pair was in a bullish trend. However, since September 21, the XRP price had been range bound between the levels of $0.45 and $60. Price has not broken the upper and lower levels of price range. Since the XRP price is ranging and if it ranges to the lower level of price range, traders should initiate long trades.
The XRP price is above the 12-day EMA and the 26-day EMA which indicates that the bullish trend is ongoing. The MACD line and the signal line are above the zero line which indicates a buy signal.
XRPUSD Short-term Trend: Ranging

On the 4-hour chart, the XRP price is falling after the resistance at $0.60. The XRP price is below the 12-day EMA and 26-day EMA which indicates that price is falling. The Relative Strength Index period 14 is level 50 which indicates that a sideways trend is ongoing.
The views and opinions expressed here do not reflect that of CryptoGlobe.com and do not constitute financial advice. Always do your own research.


