
 Litecoin Chart by Trading View
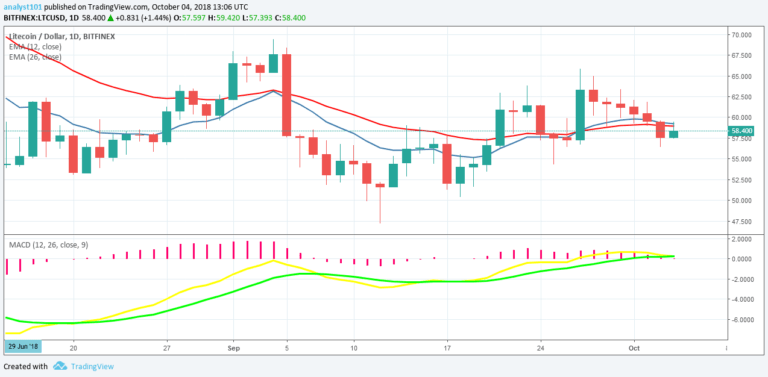
LTCUSD Medium-term Trend: Ranging
Resistance Levels: $63, $65, $67
Support Levels: $55, $53, $51
Yesterday, the LTCUSD pair was in a bearish trend and while in a bearish trend it fell to the low of $ 57.11. Today, the LTC price is in a bullish trend. Also, the LTC price is trading at the lower level of price range and if there is any bearish pressure at that level, the LTC price will depreciate further to the next support level at $45.
On the other hand, if the bulls break out of the upper level of price range, the price of Litecoin will appreciate in value. Meanwhile, the LTC price is below the 12-day EMA and the 26-day EMA which indicates that a bearish trend is continuing. The MACD line and Signal line are at par with the zero line which indicates a neutral signal.
LTCUSD Short-term Trend: Ranging
 Litecoin Chart by Trading View
On the 4-hour chart, the LTC price is in a range bound movement. The LTC price is fluctuating above $50 price level. The price of Litecoin is below the 12-day EMA and the 26-day EMA which indicates that a bearish trend is ongoing. The Relative Strength Index period 14 is level 44 indicates that price is in a sideways trend zone.
The views and opinions expressed here do not reflect that of CryptoGlobe.com and do not constitute financial advice. Always do your own research.


