
 Litecoin Chart by Trading View
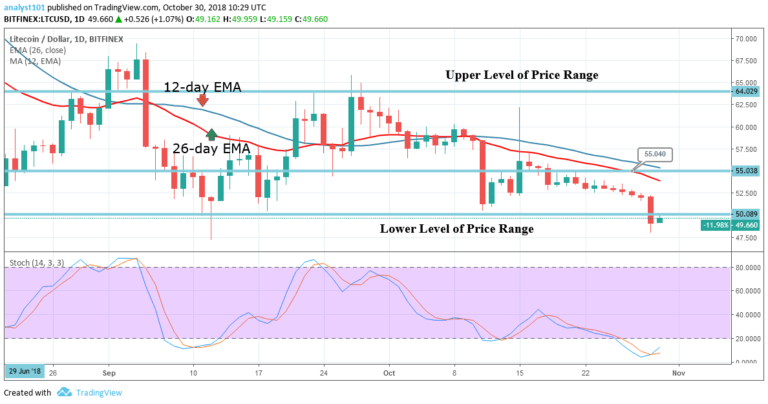
LTCUSD Medium-term Trend: Bearish
Resistance Levels: $65, $67, $69
Support Levels: $47, $45, $43
Yesterday, the price of Litecoin was in a bearish trend. The LTC price broke the lower price range at the $50 price level and fell to the low of $48. The price of Litecoin is now making a bullish movement from its low. Does that mean the bearish trend is over? The Stochastic indicator gives us a clue. A trend is said to be reversed when the blue stochastic is above the red stochastic and both bands must be out of the oversold area.
On the short term trend, the bearish trend us over. On the daily chart price of Litecoin is still in the oversold region. Meanwhile, the price of Litecoin is below the 12-day EMA and the 26-day EMA which indicates that price is in the bearish trend zone.
LTCUSD Short-term Trend: Bearish
 Litecoin Chart by Trading View
On the short term trend, the price of Litecoin is in a bearish trend. The blue stochastic line is above the red stochastic line and both are out of the oversold area of the chart. This implies that the bearish trend is over. It could be a great opportunity to initiate a long trade right from the onset of the bullish trend and at the lower price range and a stop loss order below the price of $48.
The views and opinions expressed here do not reflect that of CryptoGlobe.com and do not constitute financial advice. Always do your own research.


