 Litecoin Chart by Trading View
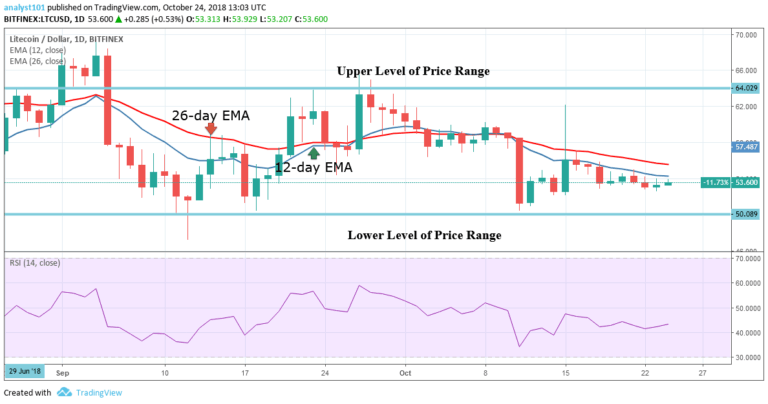
LTCUSD Medium-term Trend: Ranging
Resistance Levels: $65, $67, $69
Support Levels: $52, $50, $48
Yesterday, the price of Litecoin was in a bullish trend within the range bound zone. On September 27, the LTC price tested the upper price level and it was resisted. On October 11, the price fell to the low of $50.45 and commenced a bullish movement. The price is still at the lower price level and below the exponential moving averages (EMAs). Traders can initiate long trades at the current market price.
A stop-loss order should be placed below the $50 price level. Then exit your long trades near the upper price level. In addition, the Relative Strength Index period 14 is level 44 which indicates that the price is in the sideways trend zone.
LTCUSD Short-term Trend: Ranging
 Litecoin Chart by Trading View
On the short term trend, the price of Litecoin was in a bullish trend. On October 15, Litecoin had a price rally and price reached the high of $62 but fell to the low of $52. It had been fluctuating above the $52 level. The Relative Strength Index period 14 is level 52 which indicates that the price is in the sideways trend zone.
The views and opinions expressed here do not reflect that of CryptoGlobe.com and do not constitute financial advice. Always do your own research.