 Litecoin Chart by Trading View
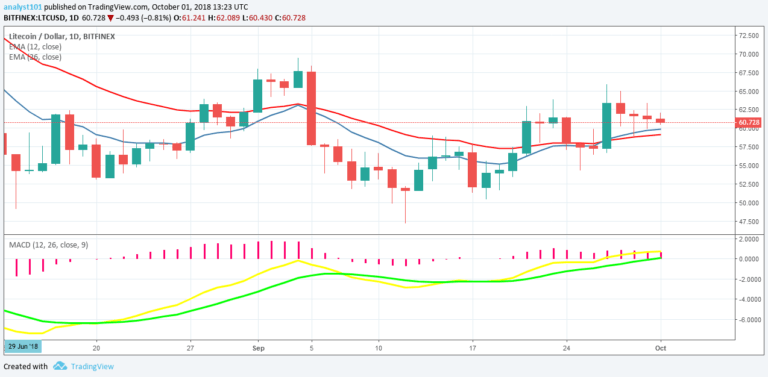
LTCUSD Medium-term Trend: Ranging
Resistance Levels: $63, $65, $67
Support Levels: $58, $56, $54
The LTCUSD price was ranging at a price of $57 when it had a bullish movement to the high of $65. With this movement, it was out of its previous range bound zone of $50 and $60.Today, the LTC price is fluctuating above $60 price level. Price breakout is likely as price consolidates above the $60 price level. However, if the price falls below this level the cryptocurrency will fall the previous zone of $50 and $60.
The Litecoin price is above the 12-day EMA and 26-day EMA which indicates that a bullish trend is continuing. The MACD line and Signal line are at par with the zero line which indicates a neutral signal.
LTCUSD Short-term Trend: Ranging
Litecoin Chart by Trading View
On the 4-hour chart, the LTC price is in a range bound movement. The price of Litecoin is neither above nor below the 12-day EMA and 26-day EMA which indicates that price is in the sideways trend zone. The Relative Strength Index period 14 is level 49 indicates that price is in a sideways trend zone.
The views and opinions expressed here do not reflect that of CryptoGlobe.com and do not constitute financial advice. Always do your own research.