
 Litecoin Chart by Trading View
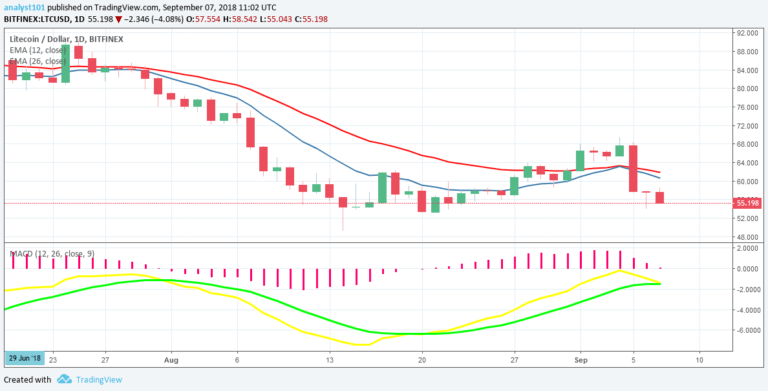
LTCUSD Medium-term Trend: Bearish
Resistance Levels: $60, $65, $70
Support Levels: $50, $45, $40
The LTCUSD pair was in a bearish trend. The bearish breakout made price fall into the previous range bound zone. The price fell to the low of $53.91 and made a bullish movement to the high of $58.42. Presently, the price is falling and approaching the price at $55. If the downward trend continued price will revisit the previous low of $50 which is our critical support level.
Litecoin price will resume its range bound movement if it fails to reach the critical support level. LTC price is below the 12-day EMA and 26-day EMA which indicates that a bearish trend is continuing. The MACD line and Signal line are below the zero line which indicates a sell signal.
LTCUSD Short-term Trend: Bearish
 Litecoin Chart by Trading View
On the 4-hour chart, the LTC price is in a bearish trend. The LTC price fell to its low and made a bullish movement to its recent high; later it resumed its downward trend. If the downward trend continued the support levels would be breached. Meanwhile, the Relative Strength Index period 14 is level 34 which indicates that the market is oversold suggesting bulls to take control of the market.
The views and opinions expressed here do not reflect that of CryptoGlobe.com and do not constitute financial advice. Always do your own research.


