
 Litecoin Chart by Trading View
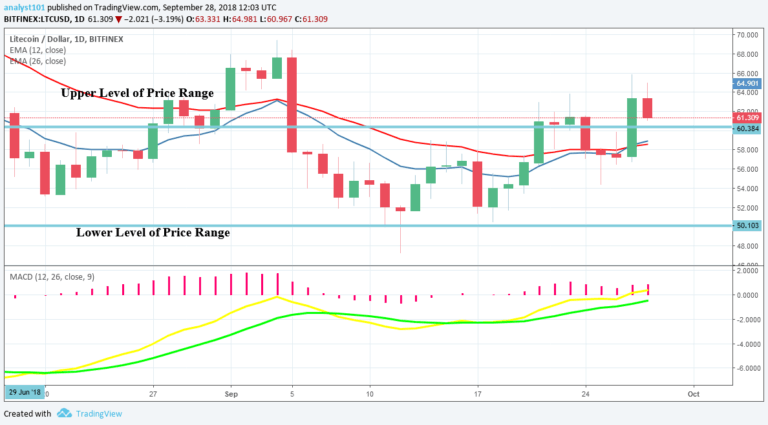
LTCUSD Medium-term Trend: Ranging
Resistance Levels: $60, $62, $64
Support Levels: $55, $53, $51
The price of Litecoin was in a bullish trend yesterday. Yesterday, the bulls reached the high of $ 64.42 but the price pulled back to the low of $63.16.The resistance at $65 price level stopped the bulls from progressing. Meanwhile, the LTC price is ranging above the $60 price level.
However, after a period of consolidation, if the price falls, it might fall to the previous range bound zone of $50-$60. On the other hand, if the price rises above this level, the cryptocurrency may face resistance at the $65 price level. Nevertheless, the LTC price is above the 12-day EMA and 26-day EMA which indicates that a bullish trend is continuing.
The MACD line and Signal line are at par with the zero line which indicates a neutral signal.
LTCUSD Short-term Trend: Ranging
 Litecoin Chart by Trading View
On the 4-hour chart, the LTC price is in a range bound movement. The price of Litecoin is above the 12-day EMA and 26-day EMA which indicates that the price is in the bullish trend zone. The Relative Strength Index period 14 is level 54 indicates that the price is in a sideways trend zone.
The views and opinions expressed here do not reflect that of CryptoGlobe.com and do not constitute financial advice. Always do your own research.


