 Litecoin Chart by Trading View
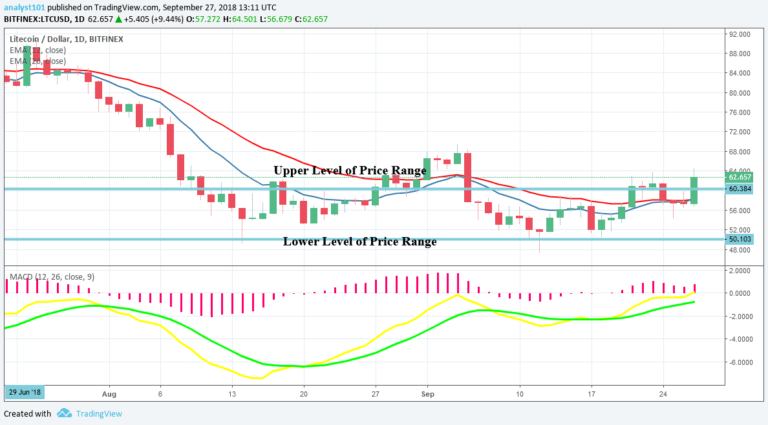
LTCUSD Medium-term Trend: Ranging
Resistance Levels: $60, $62, $64
Support Levels: $55, $53, $51
The LTC price is currently range bound while the market has been quiet. In the bullish trend of September 21, the price of Litecoin tested the upper level of the price range at $62.77. The cryptocurrency was resisted because the $60 price level was a resistance for the LTC price. Today, the LTC price has broken the upper level of the price range.
If the bulls sustain their hold on the price of Litecoin, it will be out of the range bound zone. On the other hand, if the price pulls back, the price of Litecoin will continue its range bound movement. Nevertheless, the LTC price is above the 12-day EMA and the 26-day EMA which indicates that a bullish trend is continuing. The MACD line and Signal line are above the zero line which indicates a buy signal.
LTCUSD Short-term Trend: Bullish
 Litecoin Chart by Trading View
On the 4-hour chart, the LTC price is in a bullish trend. The price has broken the upper level of price range.The price of Litecoin is above the 12-day EMA and the 26-day EMA which indicates that price is in the bullish trend zone.
The views and opinions expressed here do not reflect that of CryptoGlobe.com and do not constitute financial advice. Always do your own research.