
 Litecoin Chart by Trading View
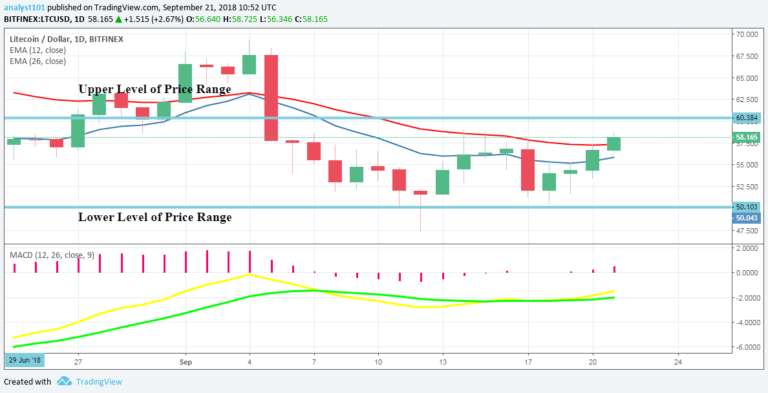
LTCUSD Medium-term Trend: Ranging
Resistance Levels: $60, $60, $62
Support Levels: $56, $54, $52
The price of Litecoin was in a bullish trend yesterday. The cryptocurrency is making a bullish movement within the range bound zone. Since September 5th, the cryptocurrency had been range bound between the levels of $60 and $50. Some of the cryptocurrencies are out of their range-bound zone in a bullish trend. Is the LTC price going to break its upper level of price range?
If the price of Litecoin breaks the upper level of $60, the cryptocurrency will reach the highs of $65 and $69. The LTC price will pullback if it fails to break the upper level of price range. Nevertheless, the LTC price is above the 12-day EMA and 26-day EMA which indicates that a bullish trend is continuing. The MACD line and Signal line are below the zero line which indicates a sell signal.
LTCUSD Short-term Trend: Bullish
 Litecoin Chart by Trading View
On the 4-hour chart, the LTC price is in a bullish trend. A bullish trend line is drawn showing the support levels where traders can initiate their long trades. The price of Litecoin is above the 12-day EMA and 26-day EMA which indicates that the price is in the bullish trend zone.
The views and opinions expressed here do not reflect that of CryptoGlobe.com and do not constitute financial advice. Always do your own research.


