
 Litecoin Chart By Trading View
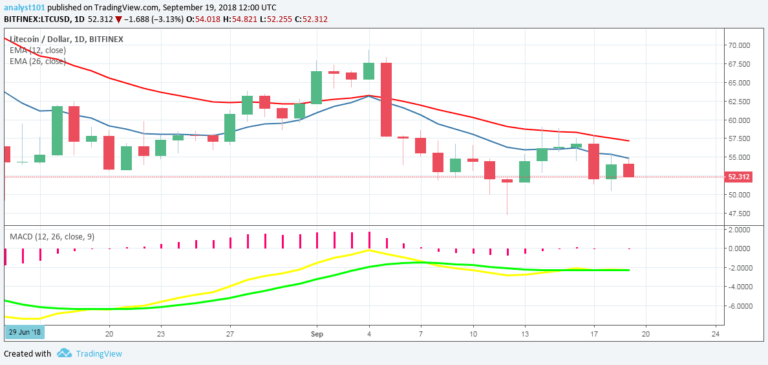
LTCUSD Medium-term Trend: Ranging
Resistance Levels: $60, $65, $70
Support Levels: $50, $45, $40
The price of Litecoin was in a bullish trend yesterday, which helped it reach a high of $ 55.48. The cryptocurrency then faced resistance, which brought the trend to an end. At that point traders could’ve entered a short position on the cryptocurrency, to then exit at the support zone.
Today, the price of the cryptocurrency is in a downward trend after being in a range bound movement. Traders should wait for the price to reach the lower level of the price range before entering a long trade. LTC’s price is below the 12-day EMA and the 26-day EMA which indicates that a bearish trend is ongoing. The MACD and signal lines are below the zero line which points to a sell signal.
LTCUSD Short-term Trend: Ranging
 Litecoin Chart By Trading View
On the 4-hour chart, LTC is in a downward trend. The cryptocurrency is falling after reaching the upper level of its price range. Remember that the range-bound levels are between $50-$60. It is not mandatory for the price to reach the end of the levels before it reverses. Meanwhile, the Relative Strength Index period 14 is level 43 which indicates the price is in a sideways trend zone.
The views and opinions expressed here do not reflect that of CryptoGlobe.com and do not constitute financial advice. Always do your own research.


