
LTCUSD Long-term Trend – Ranging
Distribution territories: $100, $120, $140.
Accumulation territories: $40, $30, $10.
Most of the cryptos first experienced a decline in their market value within a few days this week, and Litecoin was not an exception. The major decline in the market valuation of the LTCUSD took place on September 17 within the ranging region of the territories of $60 and $50.

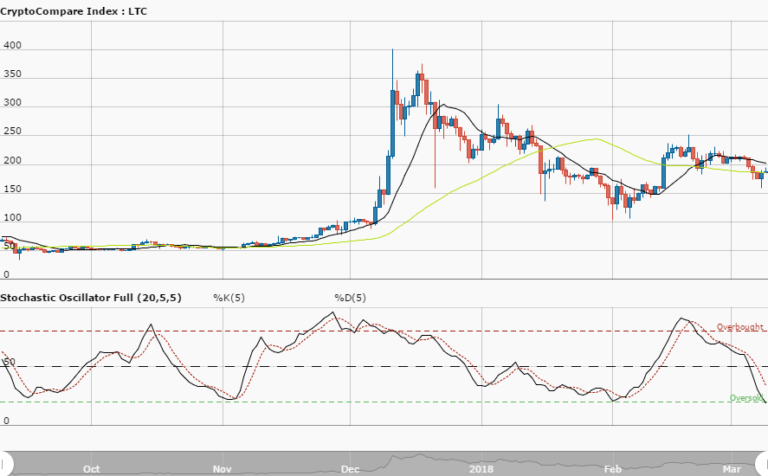
On September 18, the crypto began to successively witness another set of lower highs in the market towards the price territory of $60 where the 50-day SMA’s trend-line is found. Price action has been very faintly pushed against the trend-line of the 50-day SMA from below. The 14-day SMA is underneath the 50-day SMA. The Stochastic Oscillators have moved from the oversold region, and they are now seemingly consolidating below range 40. This means that some degree of caution needs to be exercised while placing a position. It has now been clearly established that the downward price movement of this crypto has kept reversing while it touches or a bit move past the territory of $50. In that way, a bullish market may be potentially mustering its driving force while the price moves downward towards or around the region. Traders are advised to watch out for that scenario to play out before joining the market.
The views and opinions expressed here do not reflect that of CryptoGlobe.com and do not constitute financial advice. Always do your own research.


