
BTCUSD Medium-term Trend: Ranging
Resistance levels: $7,300, $7,500, $7,700
Support levels: $7,000, $6,800, $6,600
On September 3, the price of Bitcoin was in a bullish trend. On September 2, the price reached the high of $7,302.27 and retraced to the low of $7,177.09. Thereafter, the price was range bound above the $7,200 price level and attempting to break the resistance at $7,446. Today, the price of Bitcoin is fluctuating above the $7,200 price level.
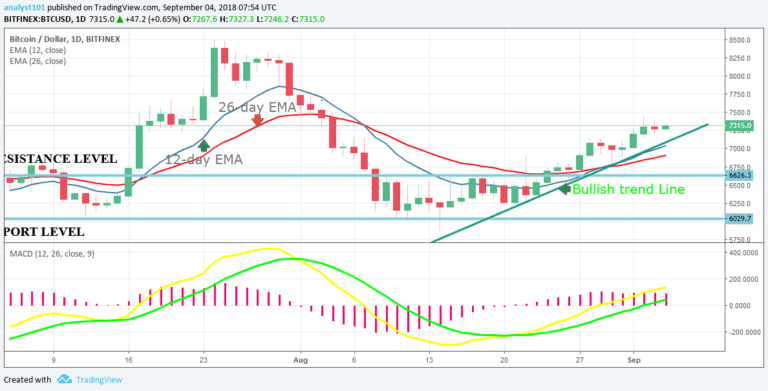
If price breaks the resistance at $7,446, the cryptocurrency will likely attain the $8,000 price level. Also, the MACD line and the signal line are above the zero line which indicates a buy signal. In addition, the price of Bitcoin is above the 12-day EMA and the 26-day EMA which indicates that the BTC price was rising.
BTCUSD Short-term Trend: Bullish

From the 4-hour chart, the BTC price is in a bullish trend. The price bars are above the 12-day EMA and 26-day EMA indicating that price is rising. Meanwhile, the Relative Strength Index period 14 is level 62 which indicates that price is in the bullish trend zone.
The views and opinions expressed here do not reflect that of CryptoGlobe.com and do not constitute financial advice. Always do your own research.