

XRP Price Medium-term Trend: Ranging
Supply levels: $0.43, $0.44, $ 0.45
Demand levels: $0.40, $0.39, $0.38
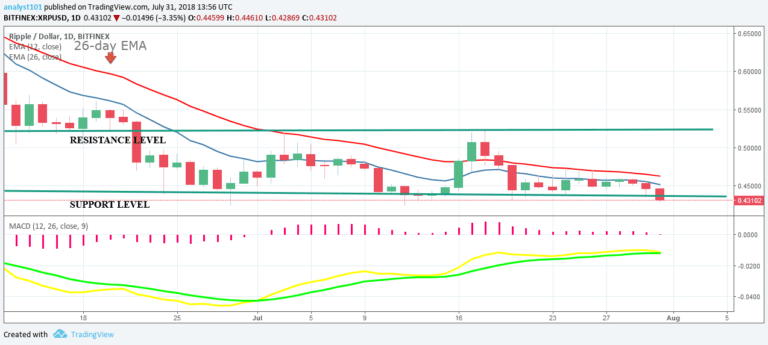
Yesterday, July 30, the XRP price was range bound between the levels of $0.51 and $0.43. Today, the bears have broken the support level $0.43.
XRP price is likely to find support at the previous low of $0.24. Meanwhile, the MACD line and the signal line are below the zero line which indicates a sell signal. Also, the price of XRP is below the 12-day EMA and 26-day EMA which indicates that a bearish trend is ongoing.
XRP Price Short-term Trend: Bearish

On the 4-hour chart, the XRP price is in a downward trend. The price of XRP has broken the support level at $043. The price of XRP is below the 12-day EMA and 26-day EMA which indicates that the bearish trend is ongoing. Meanwhile, the Relative Strength Index period 14 is level 26 which indicates that the market is oversold suggesting bulls to take control of price.
The views and opinions expressed here do not reflect that of CryptoGlobe.com and do not constitute financial advice. Always do your own research.


