

XRPUSD Medium-term Trend: Bullish
Supply Levels: $0.68, $0.69, $ 0.70
Demand levels: $0.66, $0.65, $0.64
The XRPUSD pair was in a bullish trend yesterday. The asset was trading above the $0.65 price level and was out of the range-bound levels of $0.65 and $0.55. At a price of $0.55, the asset was making a series of higher highs and higher lows. Yesterday, it was assumed that if its price broke the resistance $0.70, it would reach a high of $0.80.
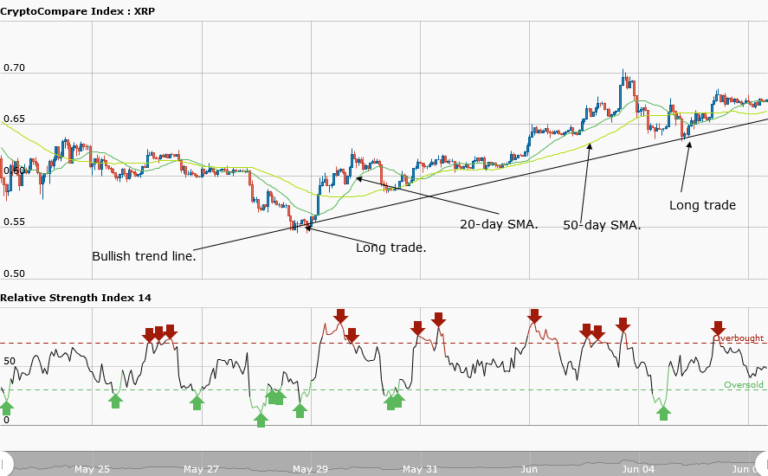
At press time Ripple is trading at $0.68. Today, its price is still in a bullish trend. A bullish trend line is drawn showing support levels with arrows pointed at them, where traders can place their long trades. If these were placed at the first pointed arrow, traders would have made partial profits by now.
Meanwhile, the bullish trend is confirmed by the moving averages which are trending northward.
XRPUSD Short-term Trend: Ranging

On the daily chart, the price of Ripple is in a ranging market. The asset has no direction, as it was in a ranged bound movement between the levels of $0.67 and $0.68
The views and opinions expressed here do not reflect that of CryptoGlobe.com and do not constitute financial advice. Always do your own research.


