
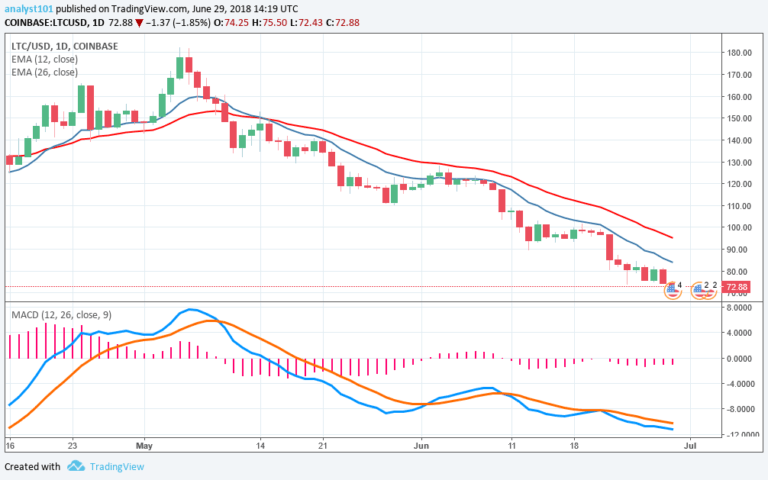

LTCUSD Medium-term Trend: Bearish
Resistance Levels: $77, $79, $81
Support Levels: $70, $68, $66
Yesterday, June 28, Litecoin was in a range bound movement. Today, the cryptoasset is in a downward trend approaching a previous low of $ 74.19. If the previous low is broken, then Litecoin will find support at $46.91. However, if the bulls resist the bearish movement, the cryptoasset may be driven into a range bound movement.
Meanwhile, the MACD and signal lines are below the zero line which indicates a sell signal. From the chart, the 12-day EMA and the 26-day EMA are above the price bars of Litecoin which indicates that a bearing trend is continuing.
LTCUSD Short-term Trend: Bearish

On the 4-hour chart, Litecoin is in a downward trend. The EMAs are trending southward and above the price of Litecoin. Meanwhile, the relative strength index period 14 is at 26 which indicates the market is oversold, suggesting the bulls may take over. As the market is oversold traders are to look for buying opportunities to allow them to initiate long positions, in anticipation of a bullish trend.
The views and opinions expressed here do not reflect that of CryptoGlobe.com and do not constitute financial advice. Always do your own research.


