

TRONIX Medium-term Trend: Bearish
Supply zones: $0.09000, $0.1000, $0.1100
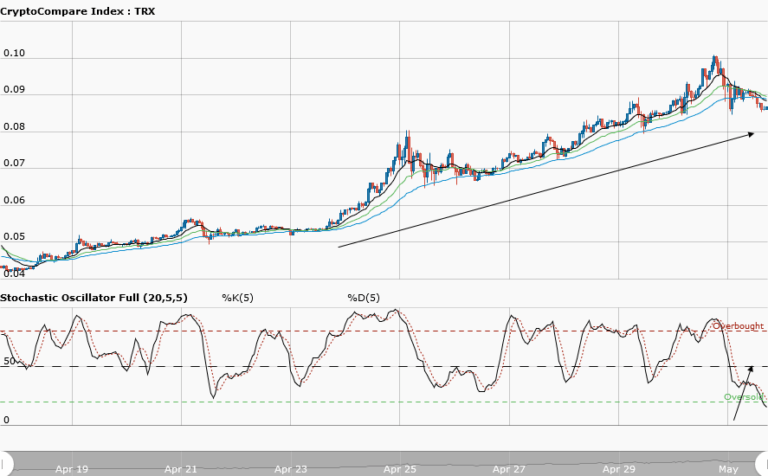
Demand zones: $0.0500, $0.0400, $0.0300
Tronix continues its bearish trend in the medium-term. The bears now dictate the market. The analysis of May 4th for a retest of the $0.08000 critical demand zone was precise. The bears pushed price to this zone. At the zone, tronix provide us with a nice double bottom, with April 29th price. This led to the bullish comeback and they drove price up to the $0.09000 supply zone. The bears’ pressure was seen and the price was forced back to the $0.0800 demand area. The chart below clearly shows that tronix is in a smooth downtrend. Rejection to the upside at the trendline shows that the bears are fully in control. The price opened bearish below the 50 exponential moving averages. This suggests more bearish pressure will be experienced in the market. The moving averages are fanned apart and this implies further bearish bias.
TRONIX Short-term Trend: Ranging

Tronix returns to the range in the short-term. The bears’ pressure was conspicuous at the $0.08400 supply area. The bears arrived fully and dragged the price down to the $0.07800 demand area. The Bulls’ effort for a comeback was thwarted at the $0.0800 supply area. The bears’ strong hold on the market was pronounced as they pushed the price down to the $0.07900 demand area. Patience is required trading tronix, as the pair is trading between the $0.08500 supply area and $0.07800 demand area. Traders should wait for a breakout at the upper range or breakdown at the lower range before taking a position in the market.
The views and opinions expressed here do not reflect that of CryptoGlobe.com and do not constitute financial advice. Always do your own research.


