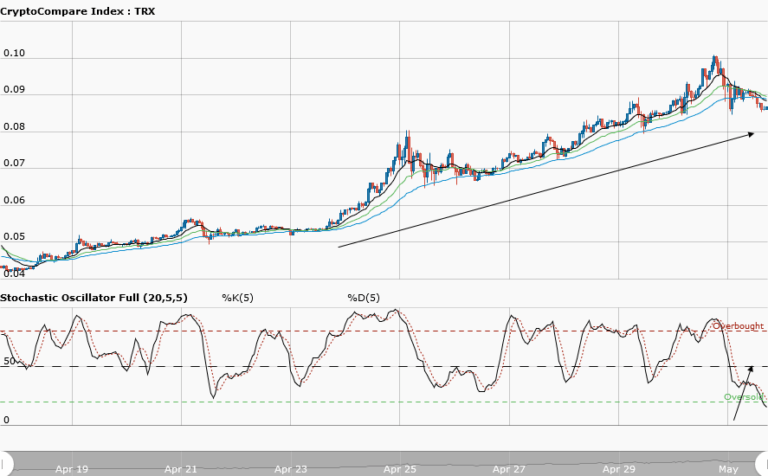
TRONIX Medium-term Trend: Bearish
Supply zones: $0.09000, $0.1000, $0.1100
Demand zones: $0.0500, $0.0400, $0.0300
Tronix looks bearish in the medium-term. The formation of a bearish pennant is seen in the chart above. In this scenario, the downward move is always favoured. Tronix gave this type of formation on May 15th. With a bearish daily opening candle at $0.06583, formed below the moving averages crossover, the bears’ momentum is likely to increase. Today’s opening price was lower than yesterday’s price of $0.06678. This suggests more sellers are present in the market. You can see that the price made three touches on the upward trendline and each touch resulted in a bounce. The fourth touch is expected soon and is likely going to result in a break. As more bearish candles formed and closed below the exponential moving averages crossover, a retest of the $0.06000 demand area may occur.
TRONIX Short-term Trend: Ranging
Tronix continues to range in the short-term. $0.07000 is the upper supply zone of the range while $0.06400 is the lower demand zone of the range. The bears’ momentum was strong as we saw the price pushed back to the lower range from the supply zone. The bulls’ efforts at this zone lifted the price and push it towards the supply zone. The battle for supremacy continues between the bulls and the bears in the short-term. Again, patience will be a good trading strategy to adopt in this scenarios, to allow for a breakout from the upper supply zone of the range or breakdown at the lower demand zone of the range, before taking a position.
The views and opinions expressed here do not reflect that of CryptoGlobe.com and do not constitute financial advice. Always do your own research.


