

XRPUSD Medium-term Trend: Bullish
Supply Levels: $0.88, $0.87, $ 0.86
Demand levels: $0.82, $0.83, $0.84
On the fundamental side the XRP/USDT listing on Binance exchange has boosted Ripple’s bullish trend. Yesterday, May 3, Ripple’s resistance level at $0.90 and the support level at $0.80 were not yet broken. We were discussing on how to trade a ranging market in the absence of a breakout. To trade a ranging market, we adopt a range bound market strategy in a market without a choppy price action. However, price of Ripple is currently trading at $0.91 as at the time of writing.
However, from the weekly chart, price of Ripple has broken the resistance level at $0.90. Price of the asset broke the resistance level with a large bullish candlestick. A bullish trend line is drawn showing the support levels of price where traders can place their long orders. It also shows the direction of the bullish trend. If the Bulls sustain hold above the resistance level, Ripple will revisit the highs of $1.10 and $1.22.
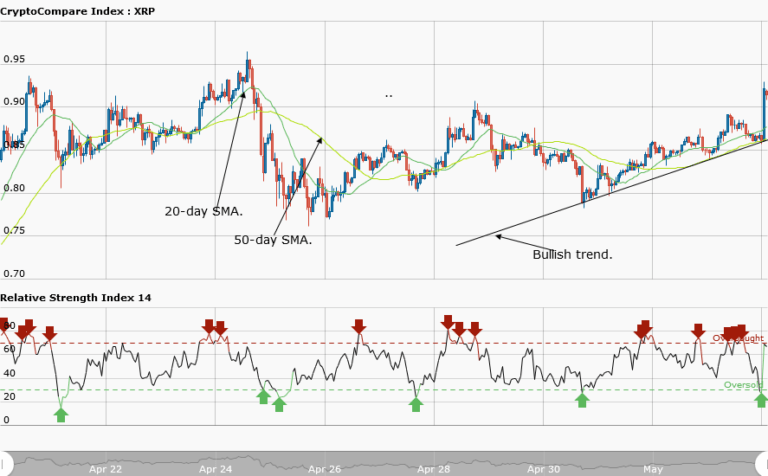
XRPUSD Short-term Trend:Bullish

In the daily chart, the XRPUSD pair was initially in a range bound movement. The asset rises from the price of $0.84 to $0.88 and ranges horizontally to $0.86. However, at the price of $0.86, thanks to the Binance listing, Ripple had a bullish breakout which took the price to the high of $0.92.
The views and opinions expressed here do not reflect that of CryptoGlobe.com and do not constitute financial advice. Always do your own research.


